Debt
Facts
At the household level, saving is often perceived as a positive thing while contracting debt is negatively perceived. But being able to borrow to finance consumption or cash flows to operate a small business plays a vital role in our economy and yields economic benefits compared to a situation where people can’t borrow. Think of how you could purchase a home without mortgage debt being available. How would you finance the purchase of expensive durables, etc? Just like it is possible to save too much or too little it is also possible to borrow too much or too little. This has welfare consequences.
Households borrow more than non-financial companies do (13 trillion compared to 10 trillion) according to Zinman (2015). More people have credit cards than participate in the stock market. Research lags behind considerably relative to the asset side of the balance sheet. We should care because this likely affects poor people more, perhaps more prompt to behavioral biases.
In recent years, household debt has been on the rise. In 2012, Canada only lagged the U.K. in terms of household debt to GDP as the following chart shows.
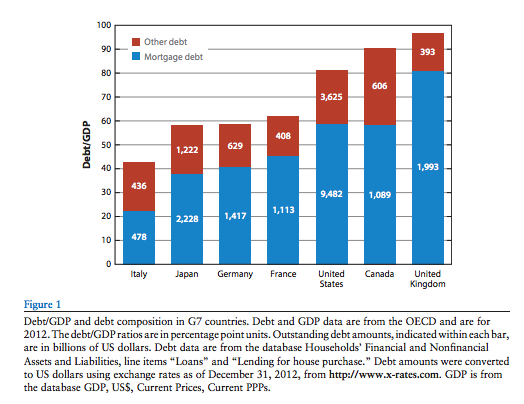
Source: Zinman (2015)
Trends
The burden of household debt is often measured as the ratio of debt to income. For example, National accounts of Canada allow to compute an aggregate measure of debt to income, using total debt and total disposable income. From 1990 to 2020, we can see the ratio of debt to income has doubled, increasing from 90% to more than 180%. Is this cause for concern?
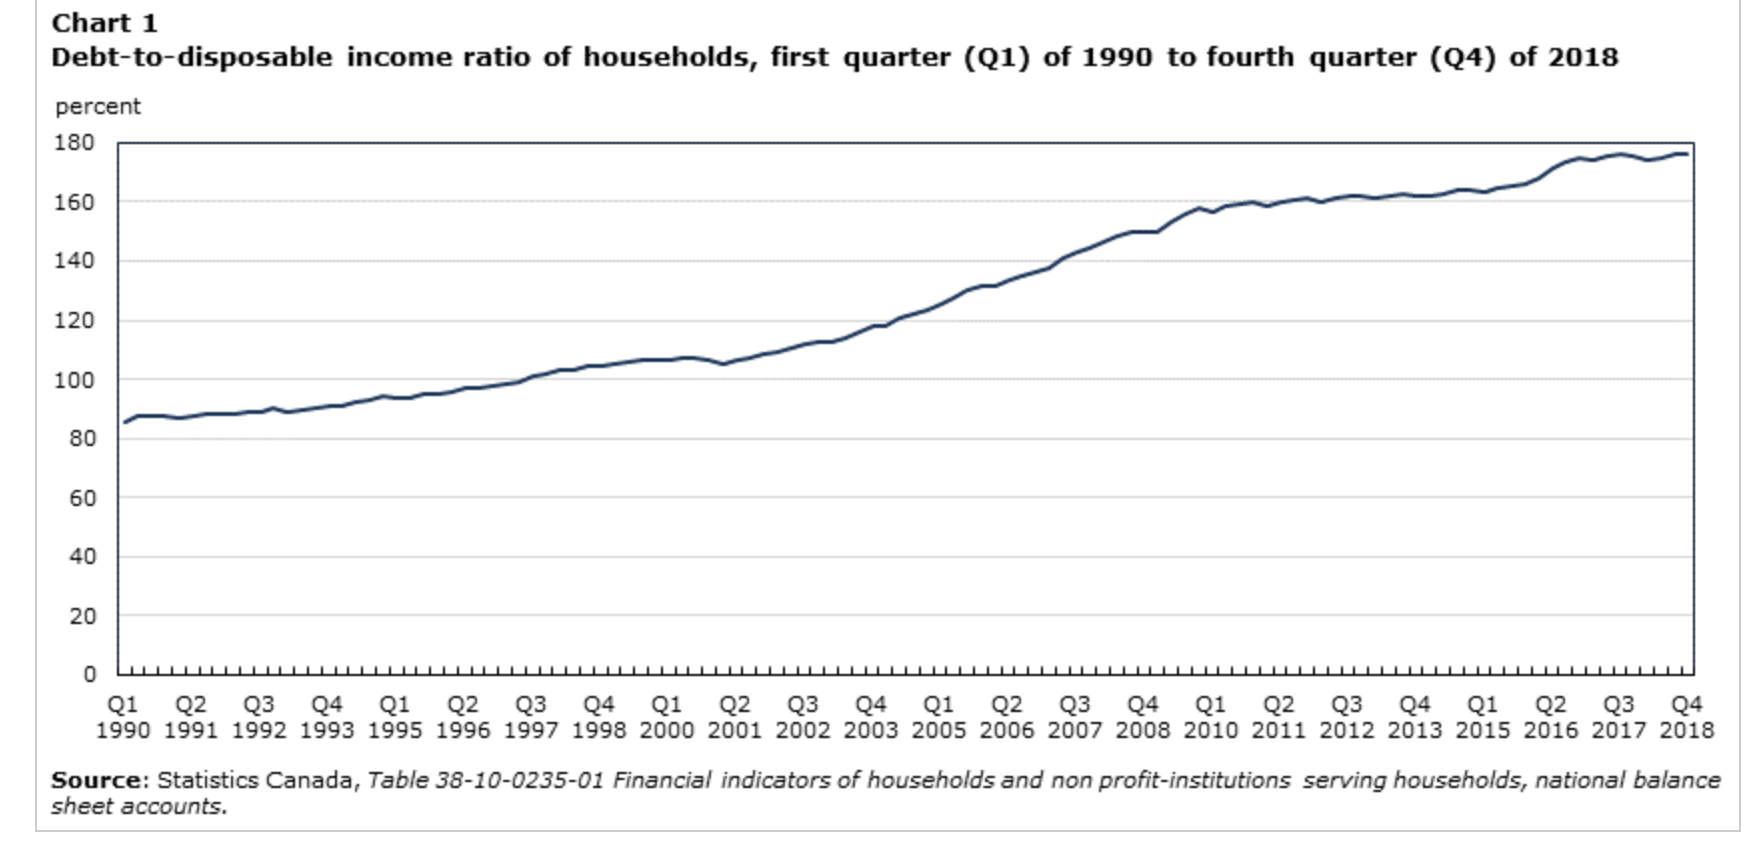
Source: Morrissette (2019)
One group that received considerable attention is the near elderly who are on the verge of retirement or have already retired. Retired households have fewer margins of adjustment when things go south (they can’t work more so easily). In a recent paper, we show that trends in the debt-to-income ratio have been stronger in the tails, suggesting that this increase is not widespread but due to a relatively large group who is massively taking on debt compared to the past.
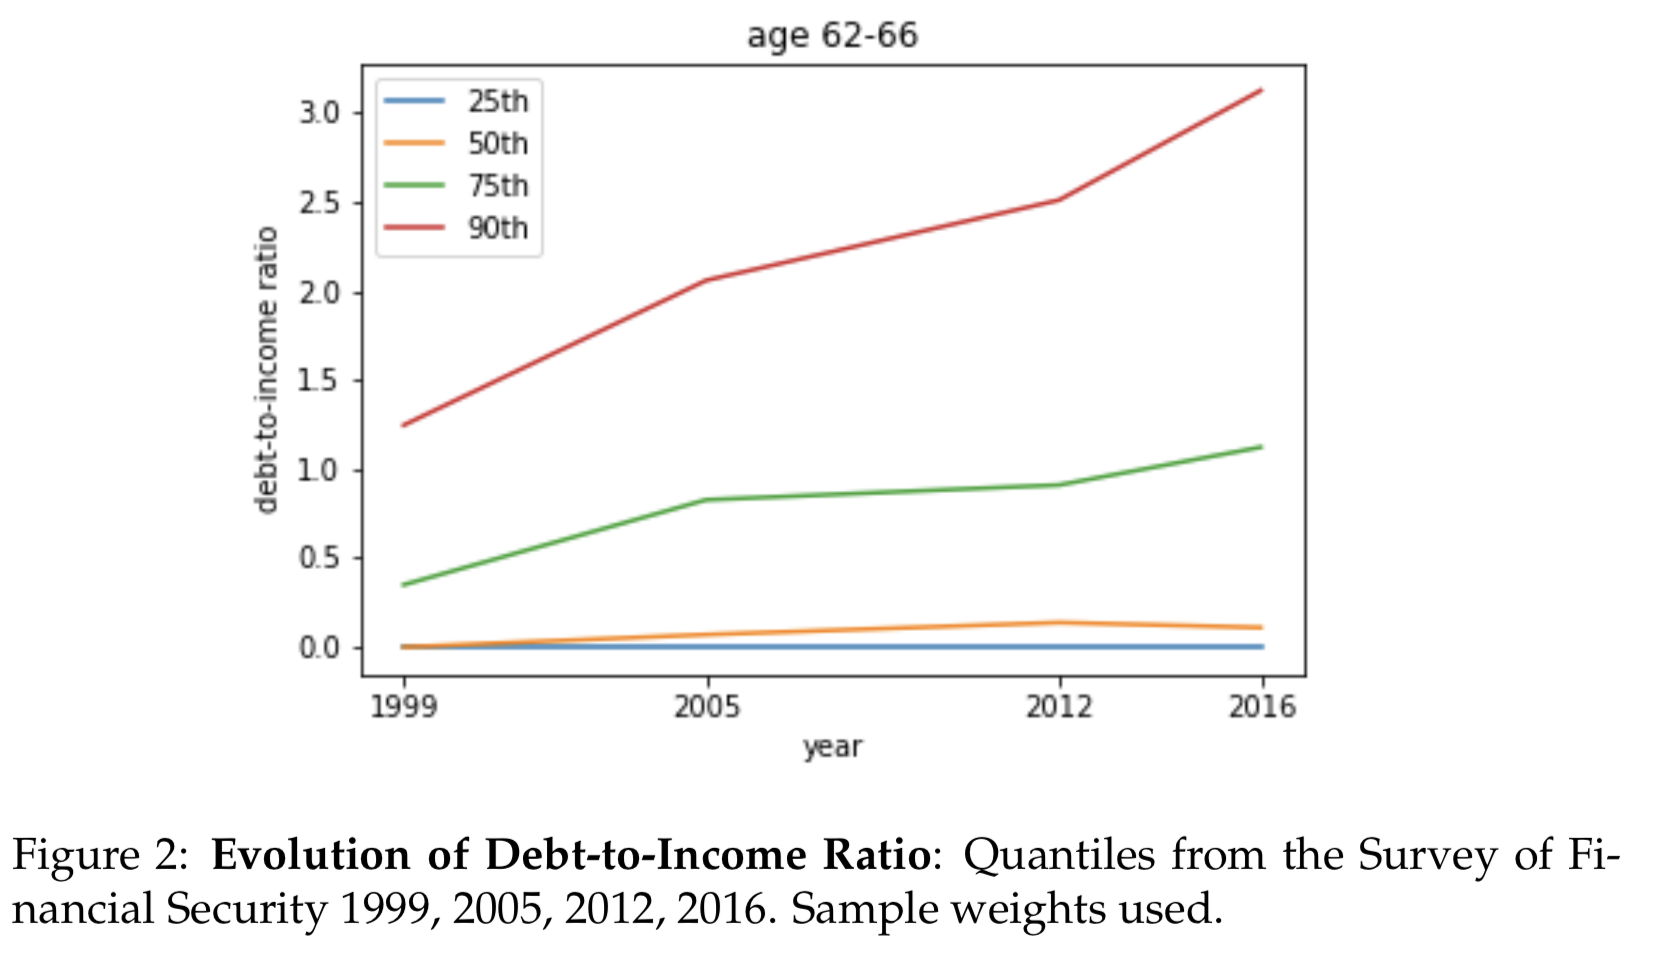
Source: Bédard and Michaud (2021)
Keeping the focus on this group, we see that while mortgage debt has increased, its share of total debt has not increased substantially over time. On the other hand, lines of credit and term loans have increased in terms of importance.
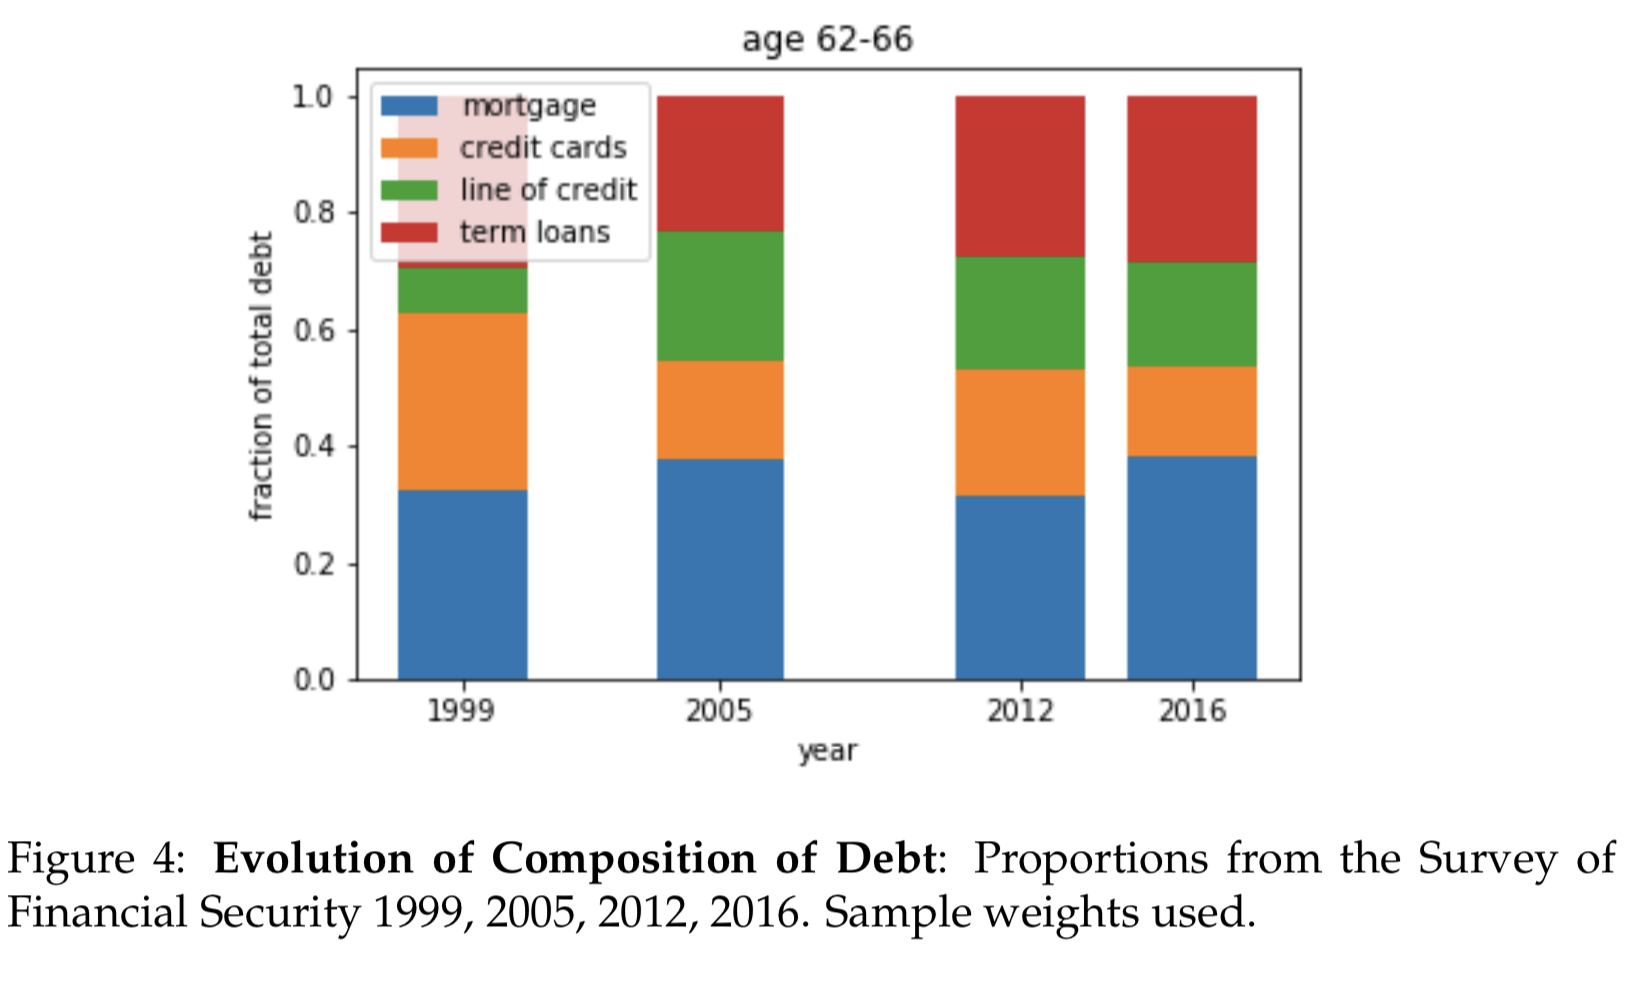
Source: Bédard and Michaud (2021)
Debt cannot be looked at in isolation. Assets have also increased in value. If higher debt holdings simply reflect the fact that more assets are accumulated, the balance sheet of households is not necessarily in a worse position. While debt to income measures to some extent the repayment capacity of households, if they hang on to their assets, debt to asset is a good measure of solvency risk of households. We see that debt to assets has increased among the near elderly but not as drastically as debt to income.
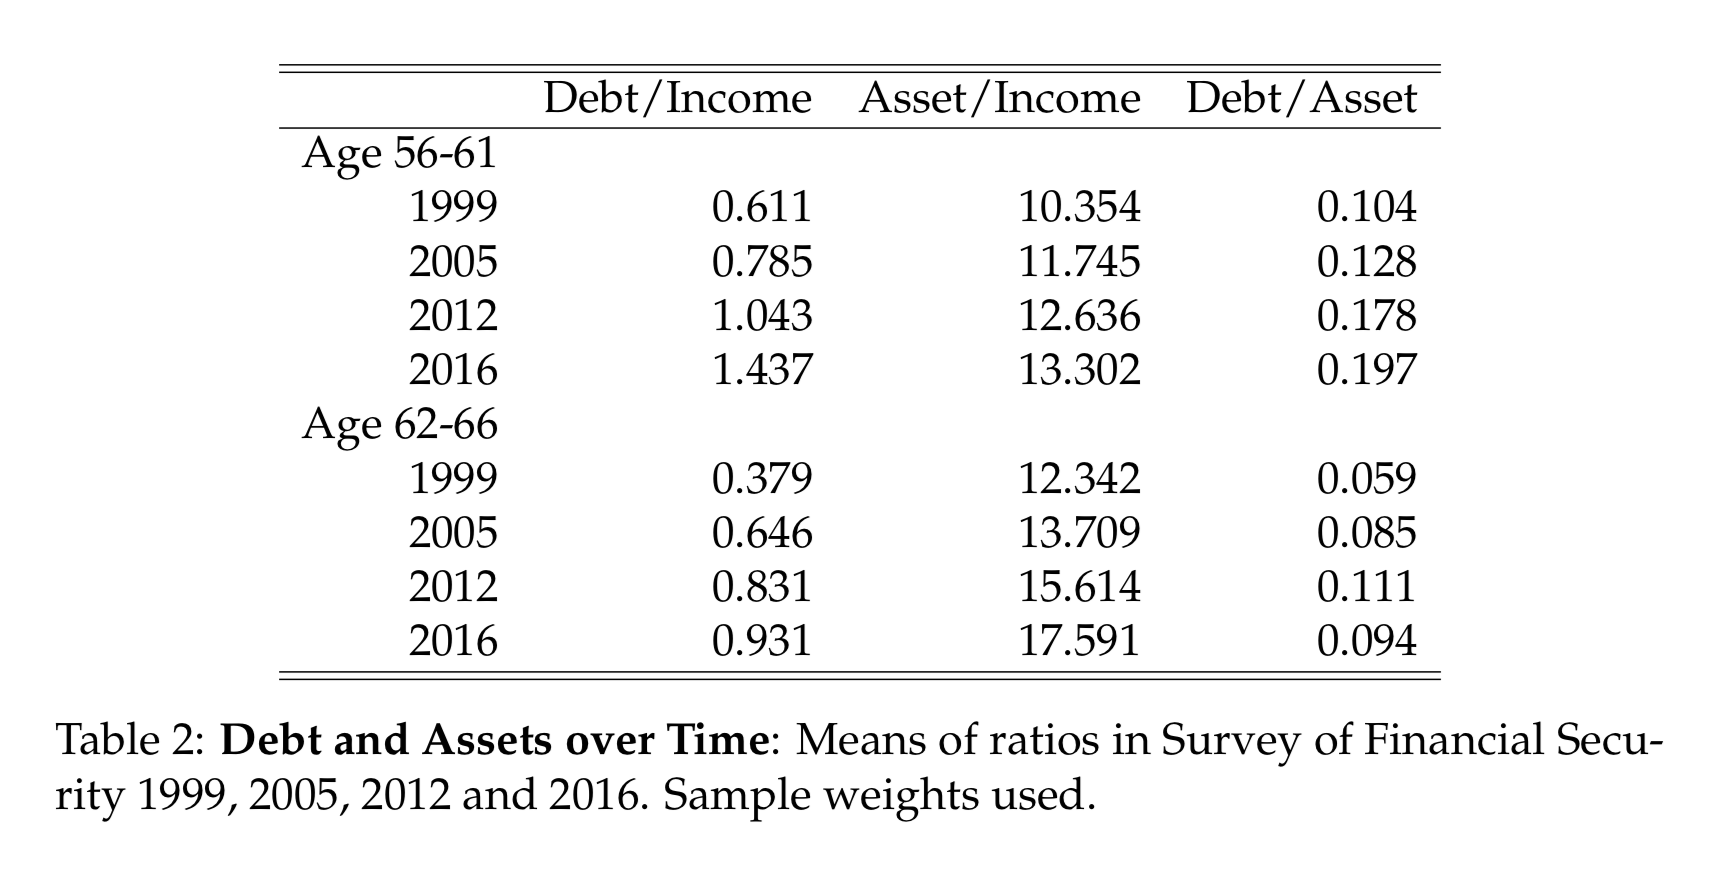
Source: Bédard and Michaud (2021)
Composition
The following figure from a Financial Consumer Agency Study in 2019 (The Canadian Financial Capability Survey or CFCS) shows that 40% of Canadians have a mortgage. Vehicle loans and credit cards are owned by respectively 28% and 29% of the population. Lines of credit by 20% while home equity backed lines of credit (HELOC) by 13% of the population. 11% have student loans while 5% have secondary mortgages and other personal loans.
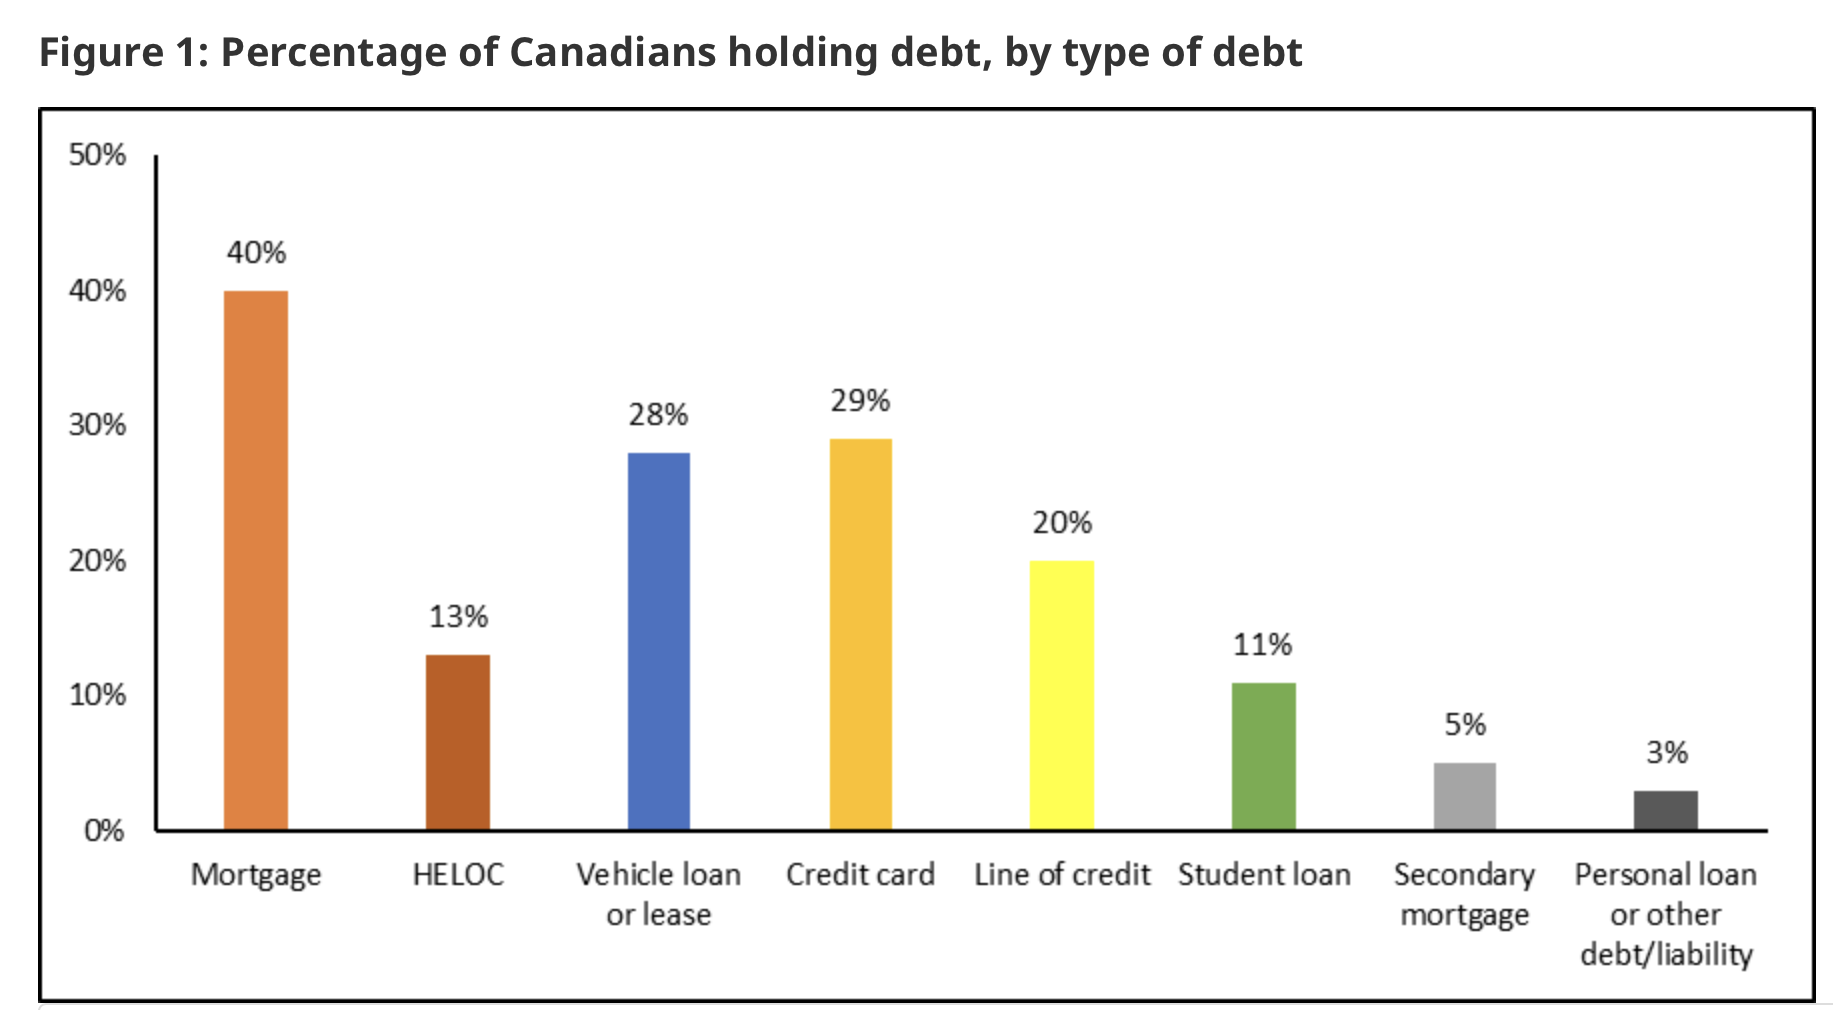
Source: FCAC (2021)
By far, the category with the largest debt is mortgage debt, with an average value of 262,000$ for those with a mortgage. The average amount is much lower for other types of debt, between 28000$ and 40000$.
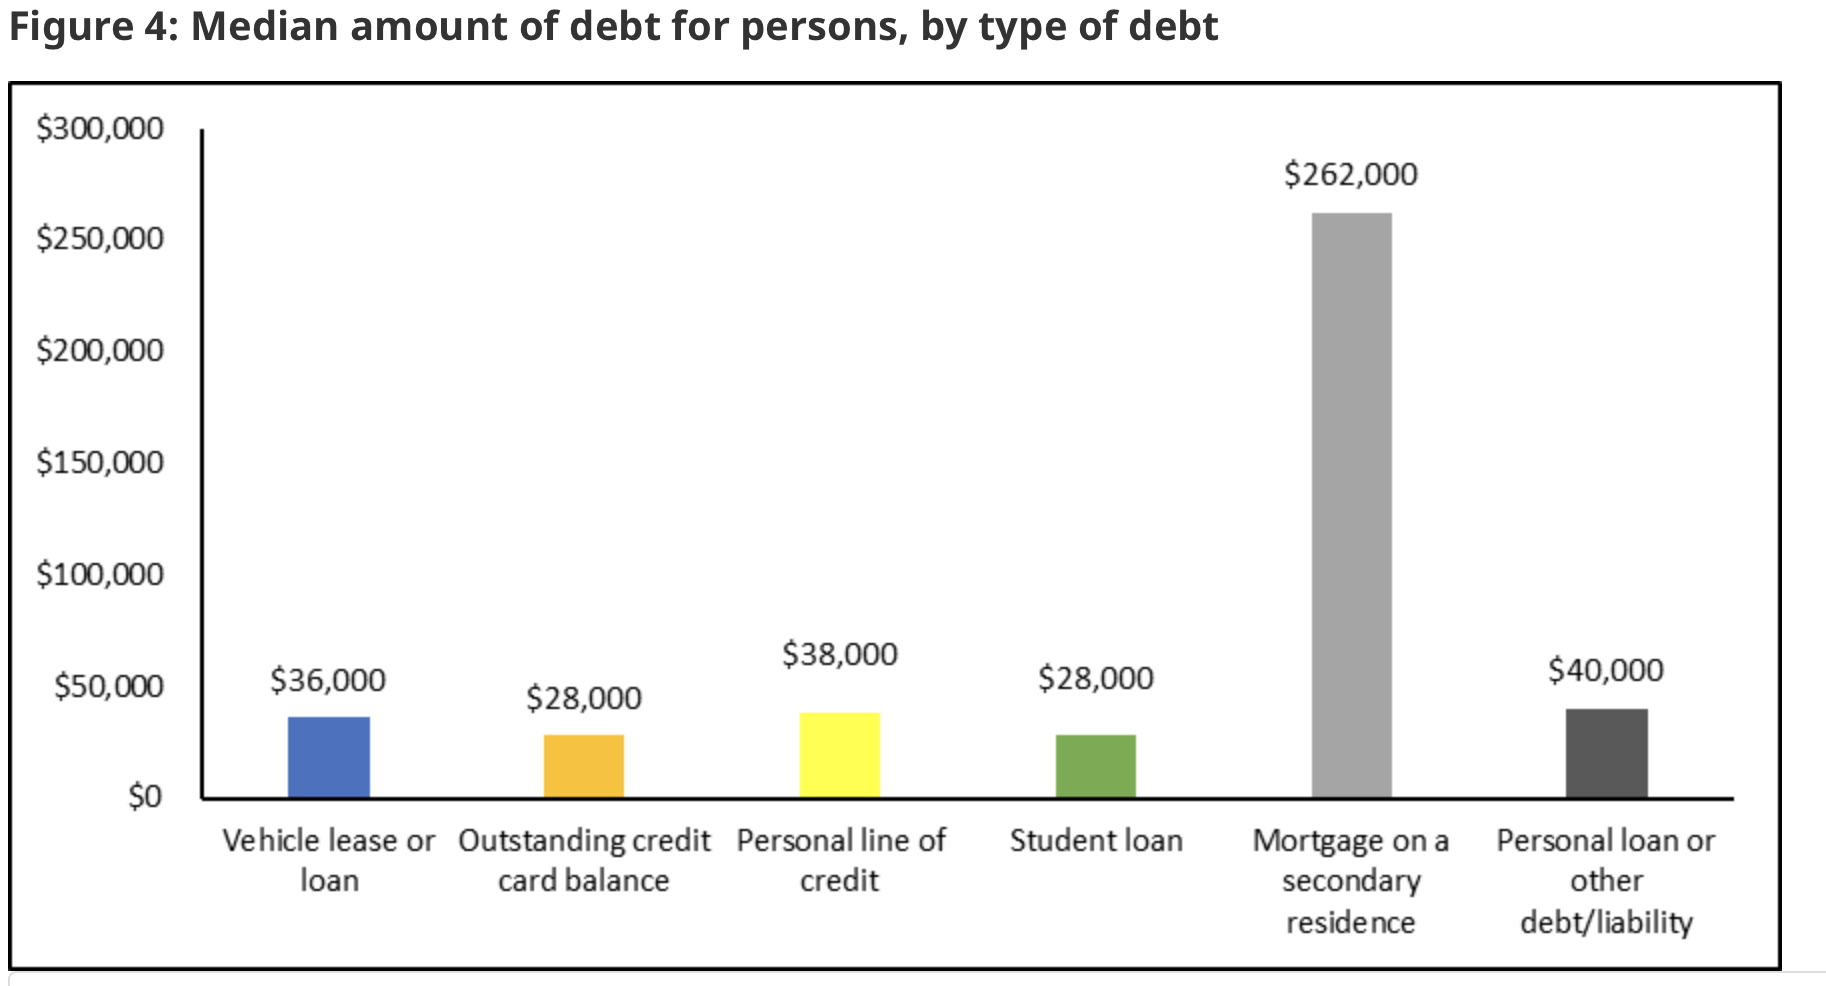
Source: FCAC (2021)
Mortgage Debt
Mortgages are backed by the value of the asset, the house. We see that the distribution of outstanding mortgages is centered in values between 100 000$ and 200 000$. Less than 12% of households have a mortgage in excess of 400 000$.
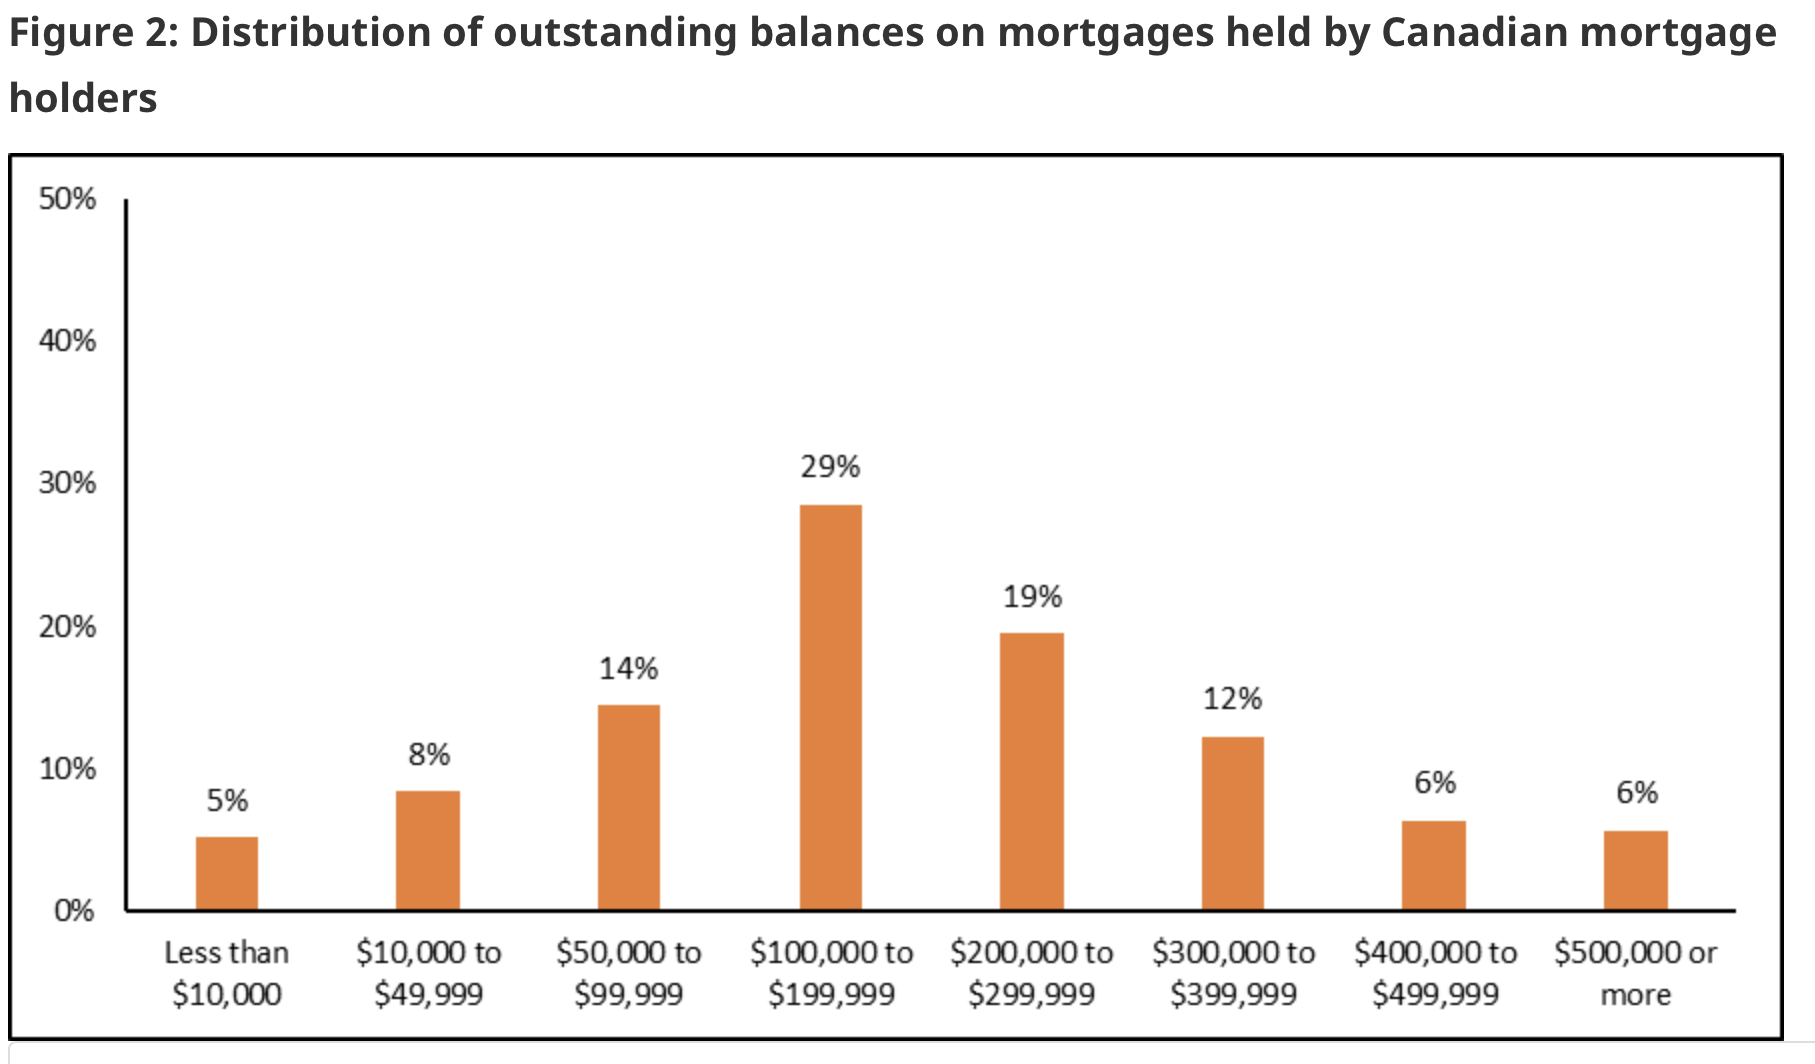
Source: FCAC (2021)
Because Canada is one of the OECD countries where the value of houses has increased the most, this has certainly played a role in explaining how debt has increased over time in Canada. The following figure shows house price indices for the three major Canadian cities: Toronto, Vancouver and Montréal. Growth has been almost exponential in Toronto and Vancouver in the last 10 years while it has been more modest in Montréal. In recent years, and in particular with the pandemic, house prices have risen sharply in all of these cities, in particular in the Montréal region. This has implications for thinking about mortgage debt.
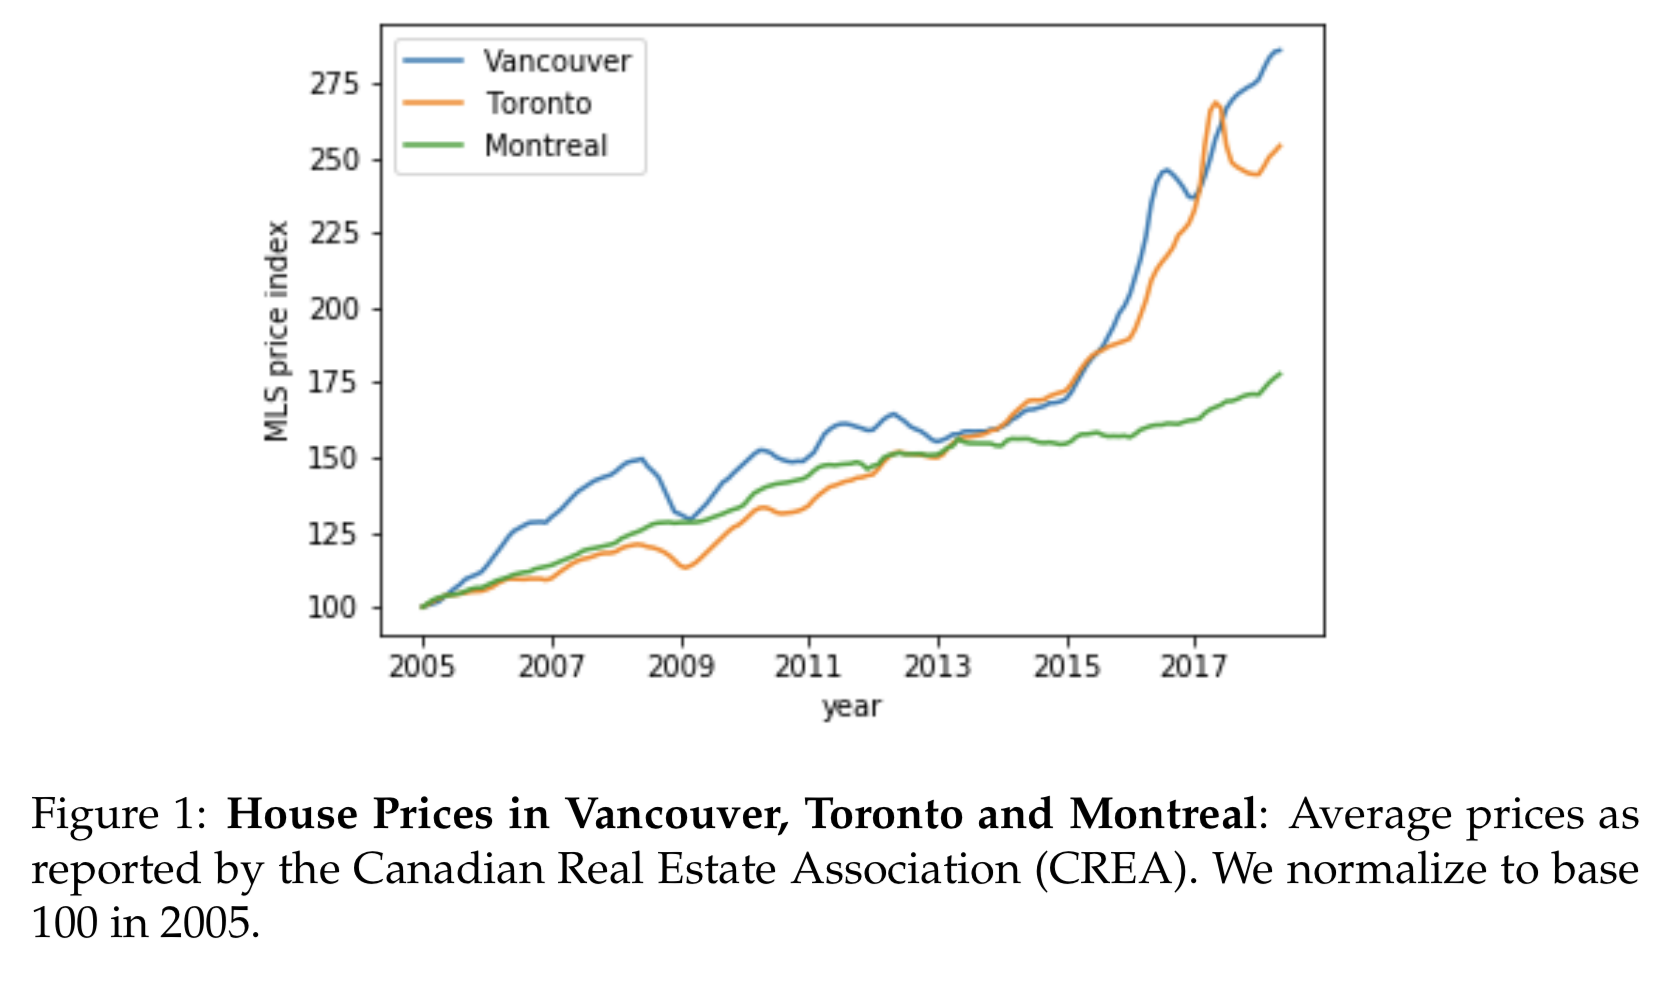
Source: Bédard and Michaud (2021)
Interest rates on mortgages have declined sharply over the last 20 years, following the general downward trend in interest rates. Hence, borrowing costs have declined at the same time as house prices have increased. As shown in the following table from Bédard and Michaud (2011), mortgage payments have actually stagnated, if not declined, over the period while mortgage balances have increased considerably. This means that the increase in house prices leads to much larger mortgages but payments which are kept constant relative to income. This is an important observation which is hidden when we look only at debt to income for repayment capacity. Interest rates are key. If interest rates go back up, some households could end up with a worse financial outlook.
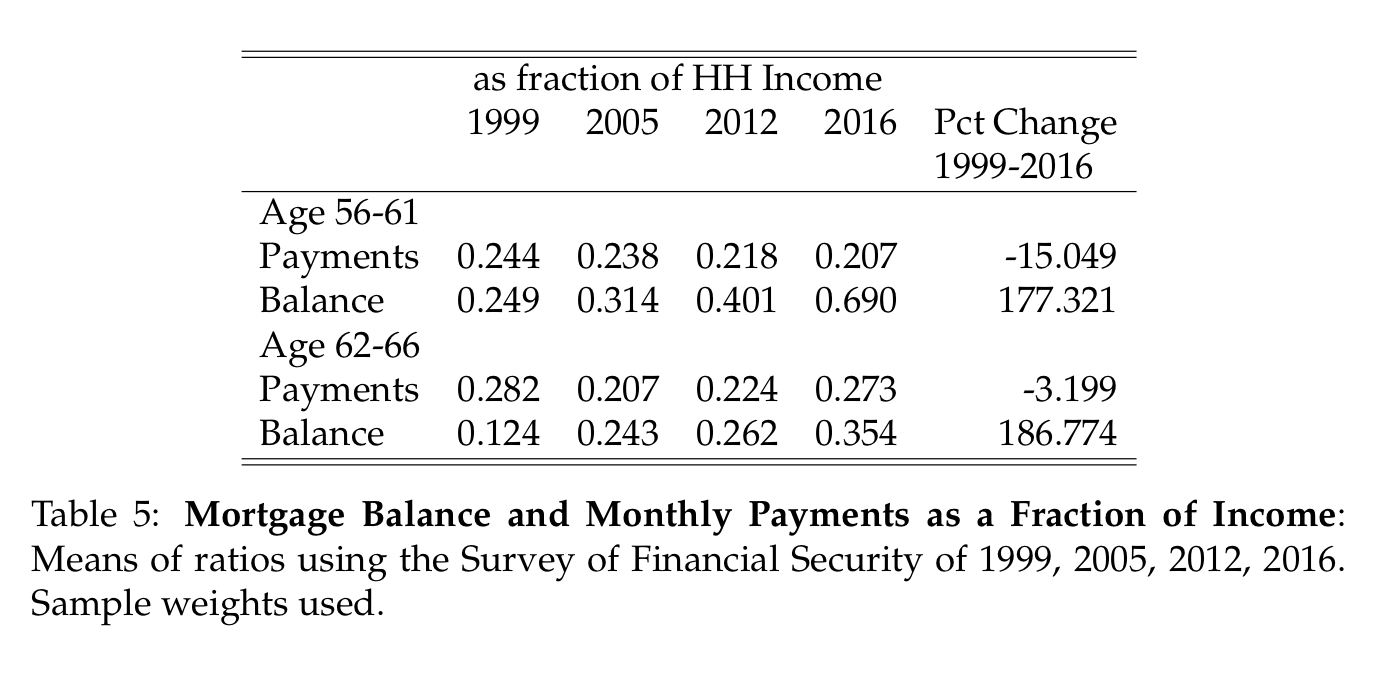
Source: Bédard and Michaud (2021)
It is important to understand how mortgages work. There are two types of mortgages in Canada, fixed and variable rate mortgages. The term of a mortgage is typically something like 25 years. But unlike mortgages in countries such as the U.S., the interest rate on the mortgage is renegotiated (renewed) more frequently, very often with a frequency of 5 years. Rates are either variable or fixed and there is a wide variety of arrangements. When rates change at renewal, payments or the term of the mortgage can change to adjust. More than three quarters of mortgages in Canada are fixed mortgages while one fourth are variable rates. It is possible to prepay a mortgage by making additional payments, up to some limit. It is also possible to borrow against home equity either by increasing the mortgage contract or by using a home-equity line of credit (HELOC).
Lines of Credit
Lines of credit are popular in Canada, more so than in the U.S. In particular, home-equity lines of credit are becoming quite popular for households who are house rich but cash-poor. While rates on lines of credit are slightly higher than the prime mortgage rate, they remain a relatively cheap form of flexible borrowing for unexpected expenses or for home-related projects such as renovations. Interestingly, more than 38% of people with lines of credit do not have outstanding balance. Hence, they have this credit available in case they need it. If we add those to individuals with balances less than 50 000$, we get that 77% of individuals have balances of less than 50 000$.
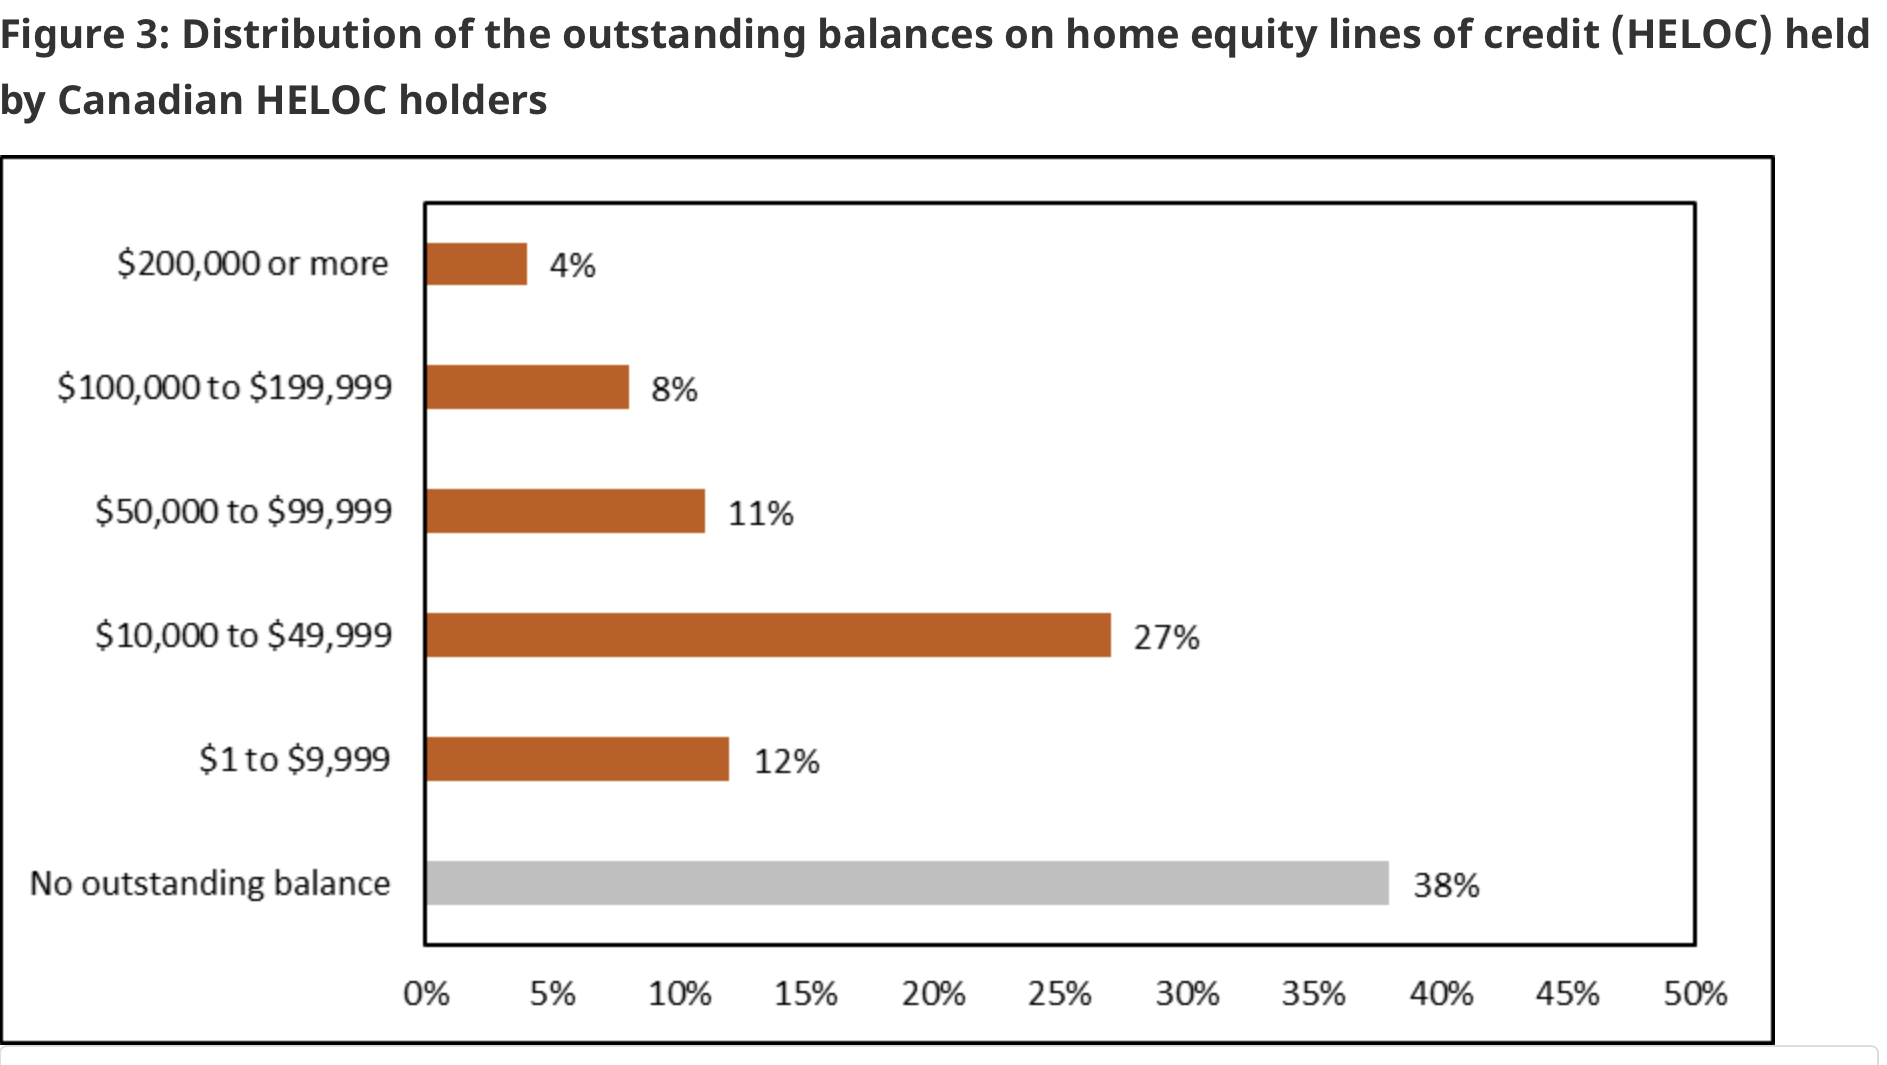
Source: FCAC (2021)
Credit Cards
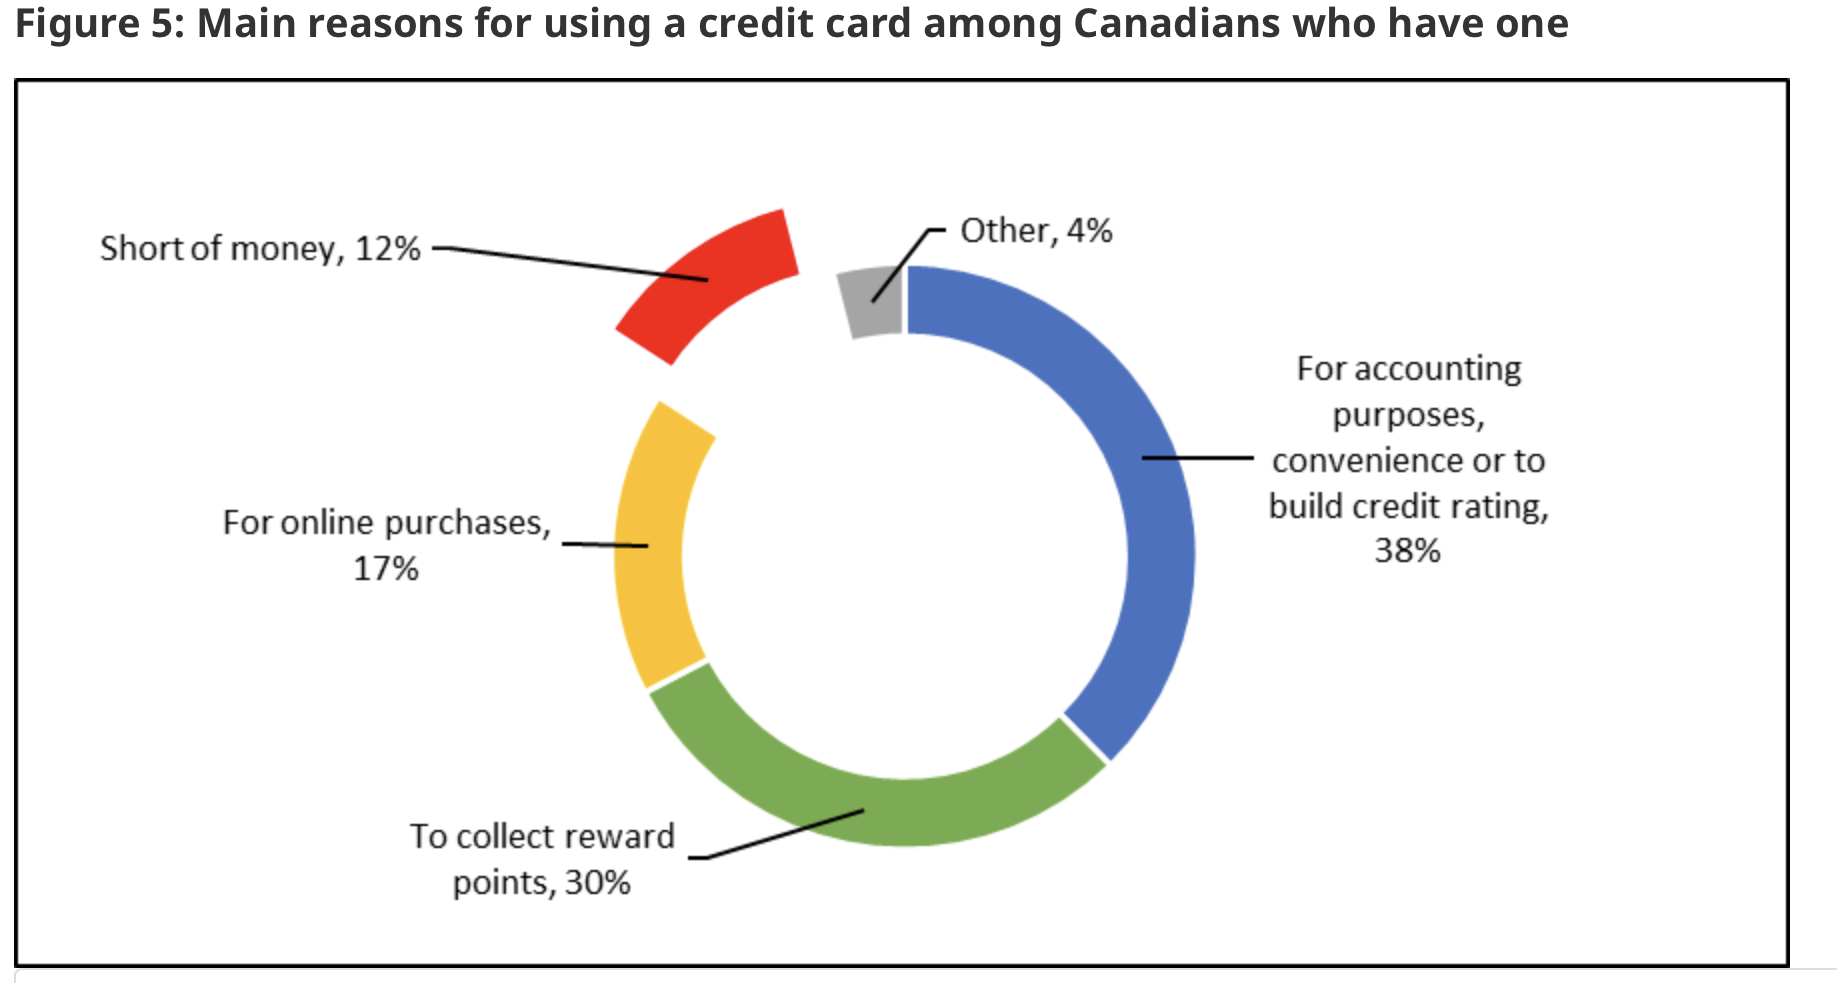
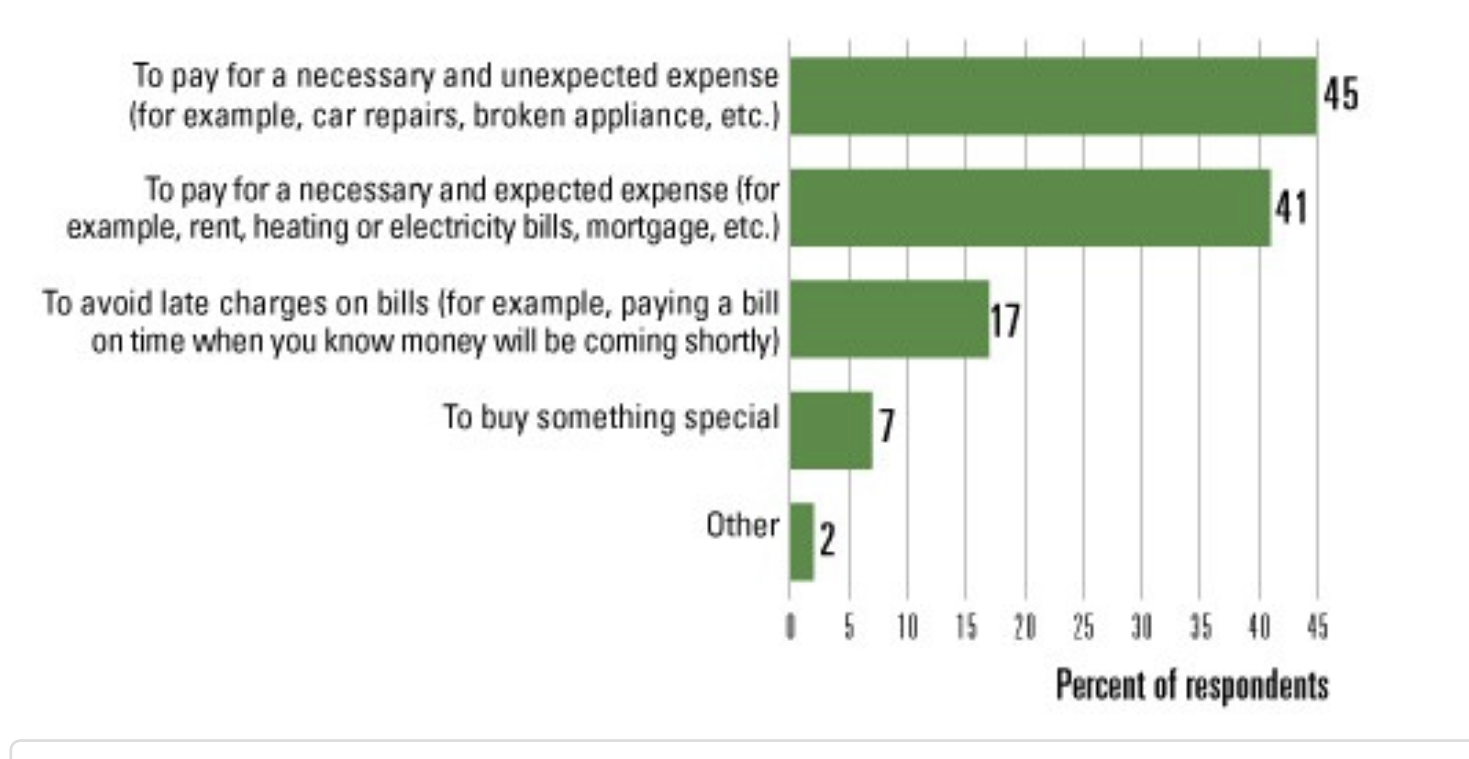
The use of credit cards as revolving credit has been one of the key financial innovations for households in the last 30 years. Their use is now widespread. Since it represents unsecured lending, credit card interest rates are much higher than rates on other types of loans (typically closer to 15%). But their usefulness in transactions, in particular online, means that they are quite useful for short-term borrowing or as a payment method. As one can see from the FCAC study, few actually use it because they are short of money (less than 12%). Interestingly, 17% use it for online purchases, 30% to collect reward points and finally 38% for accounting purposes and convenience.
Source: FCAC (2021)
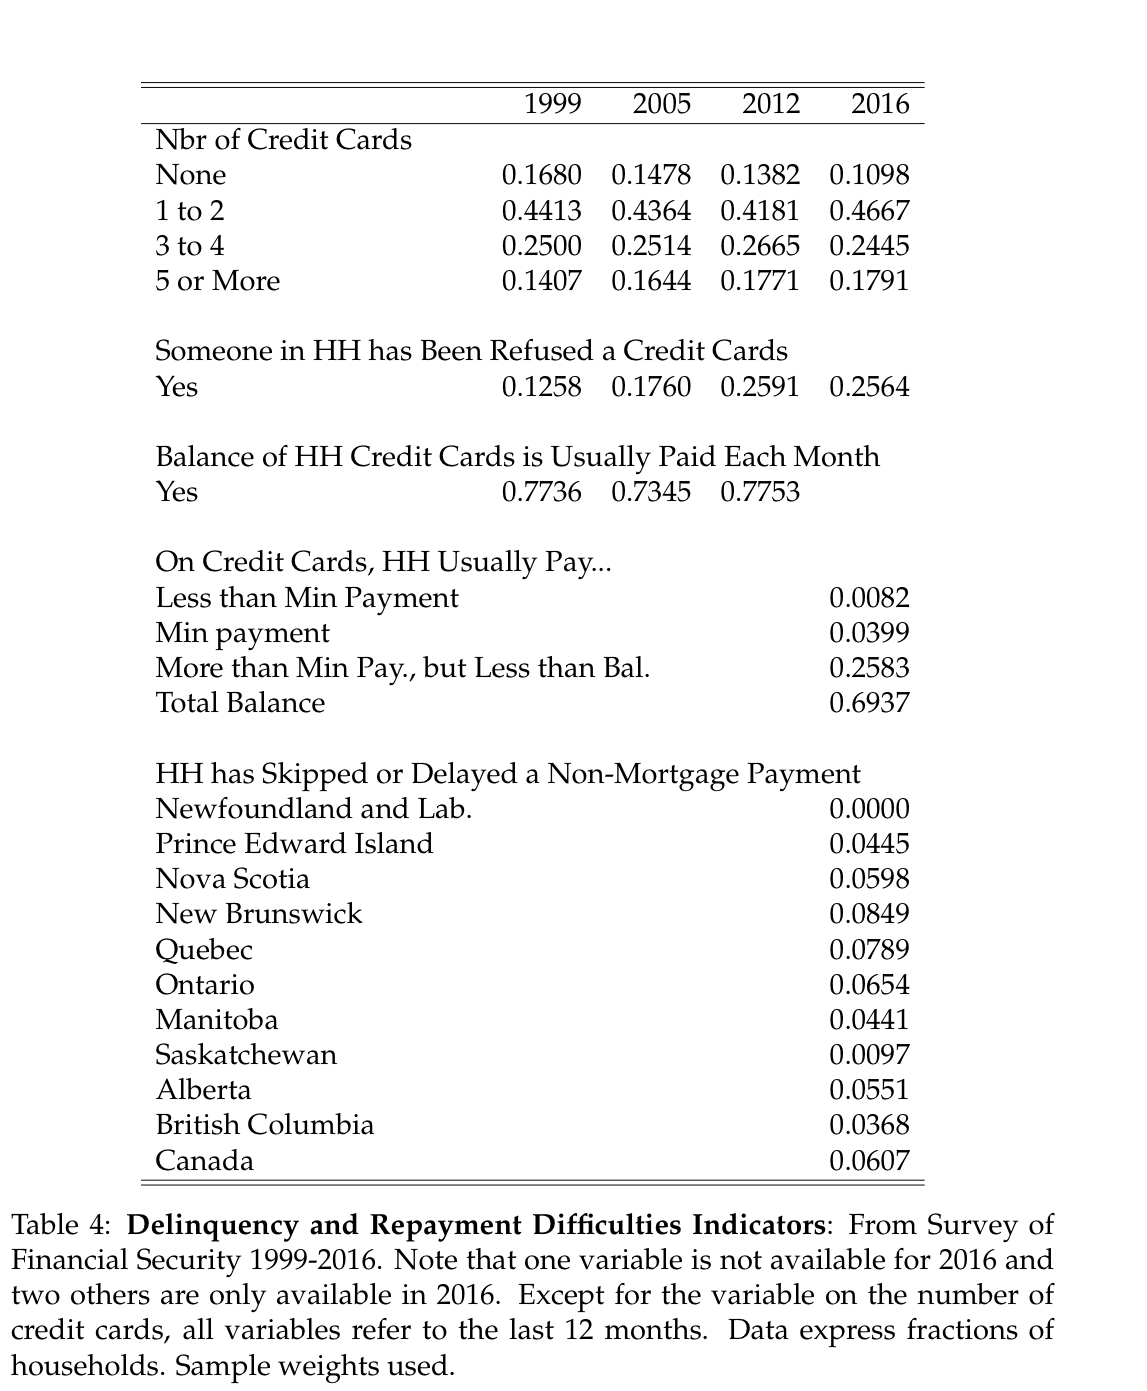
In 2016, most near retirees had a credit card (89%) with still 17.9% having more than 5 cards in the household. Credit card lending has seen some tightening up in recent years and the evidence below shows that a growing proportion has been rejected for a credit card. Similar to what is found in the FCAC study, more than three quarters of individuals near retirement pay their card in full each month. This is important has interest kicks in on credit card for credit lasting more than one month (within the month, it does not carry interest). In terms of making payments, close to 5% of individuals near retirement typically pay the minimum or less. Close to a quarter pays more than the minimum but typically not the full balance. Finally, less than 6% of near retirees skip or delay non-mortgage payments and this percentage varies somewhat across provinces but remains relatively low.
Source: Bédard and Michaud (2021)
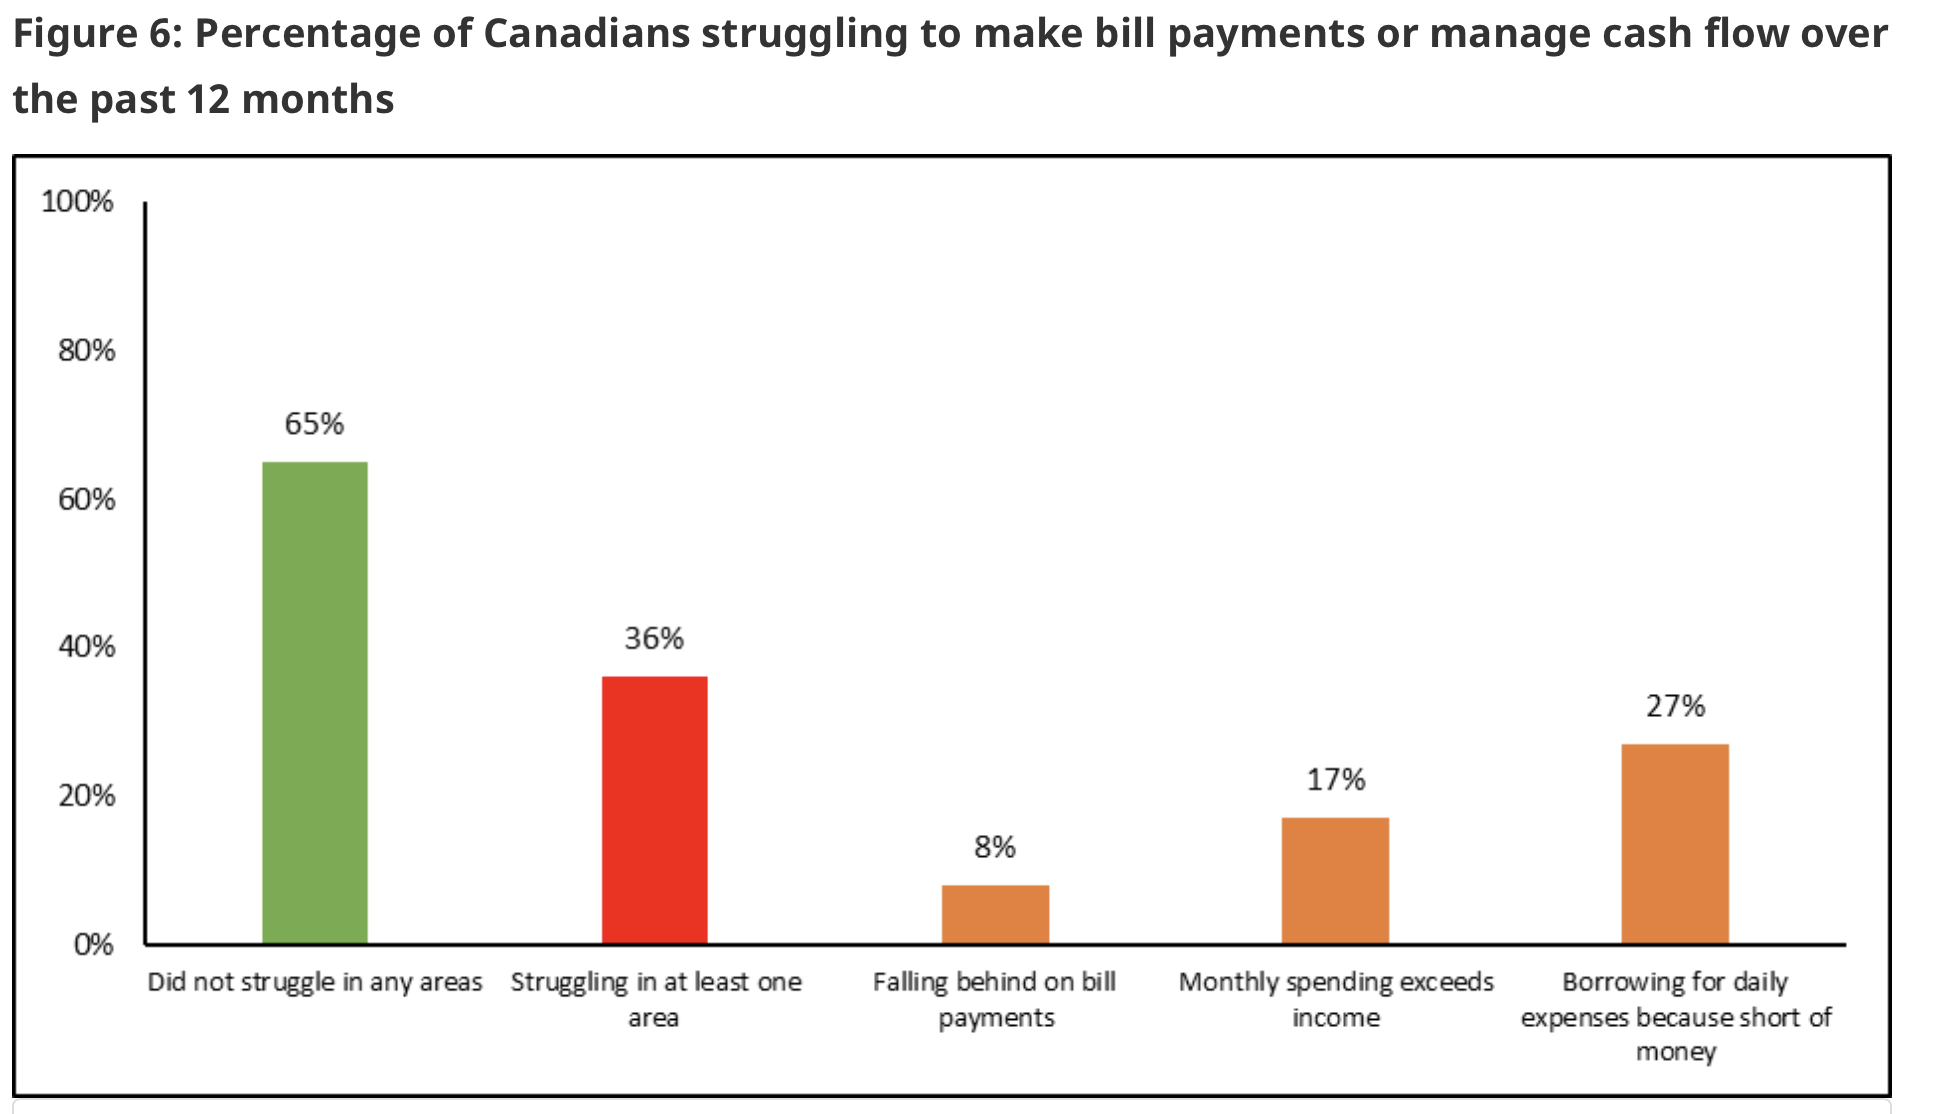
In terms of bill payments, which includes credit card payments, close to two thirds of Canadians report that they do not struggle in any area. Quite worrisome, 27% borrow for daily expenses because they report being short on money.
Source: FCAC (2021)
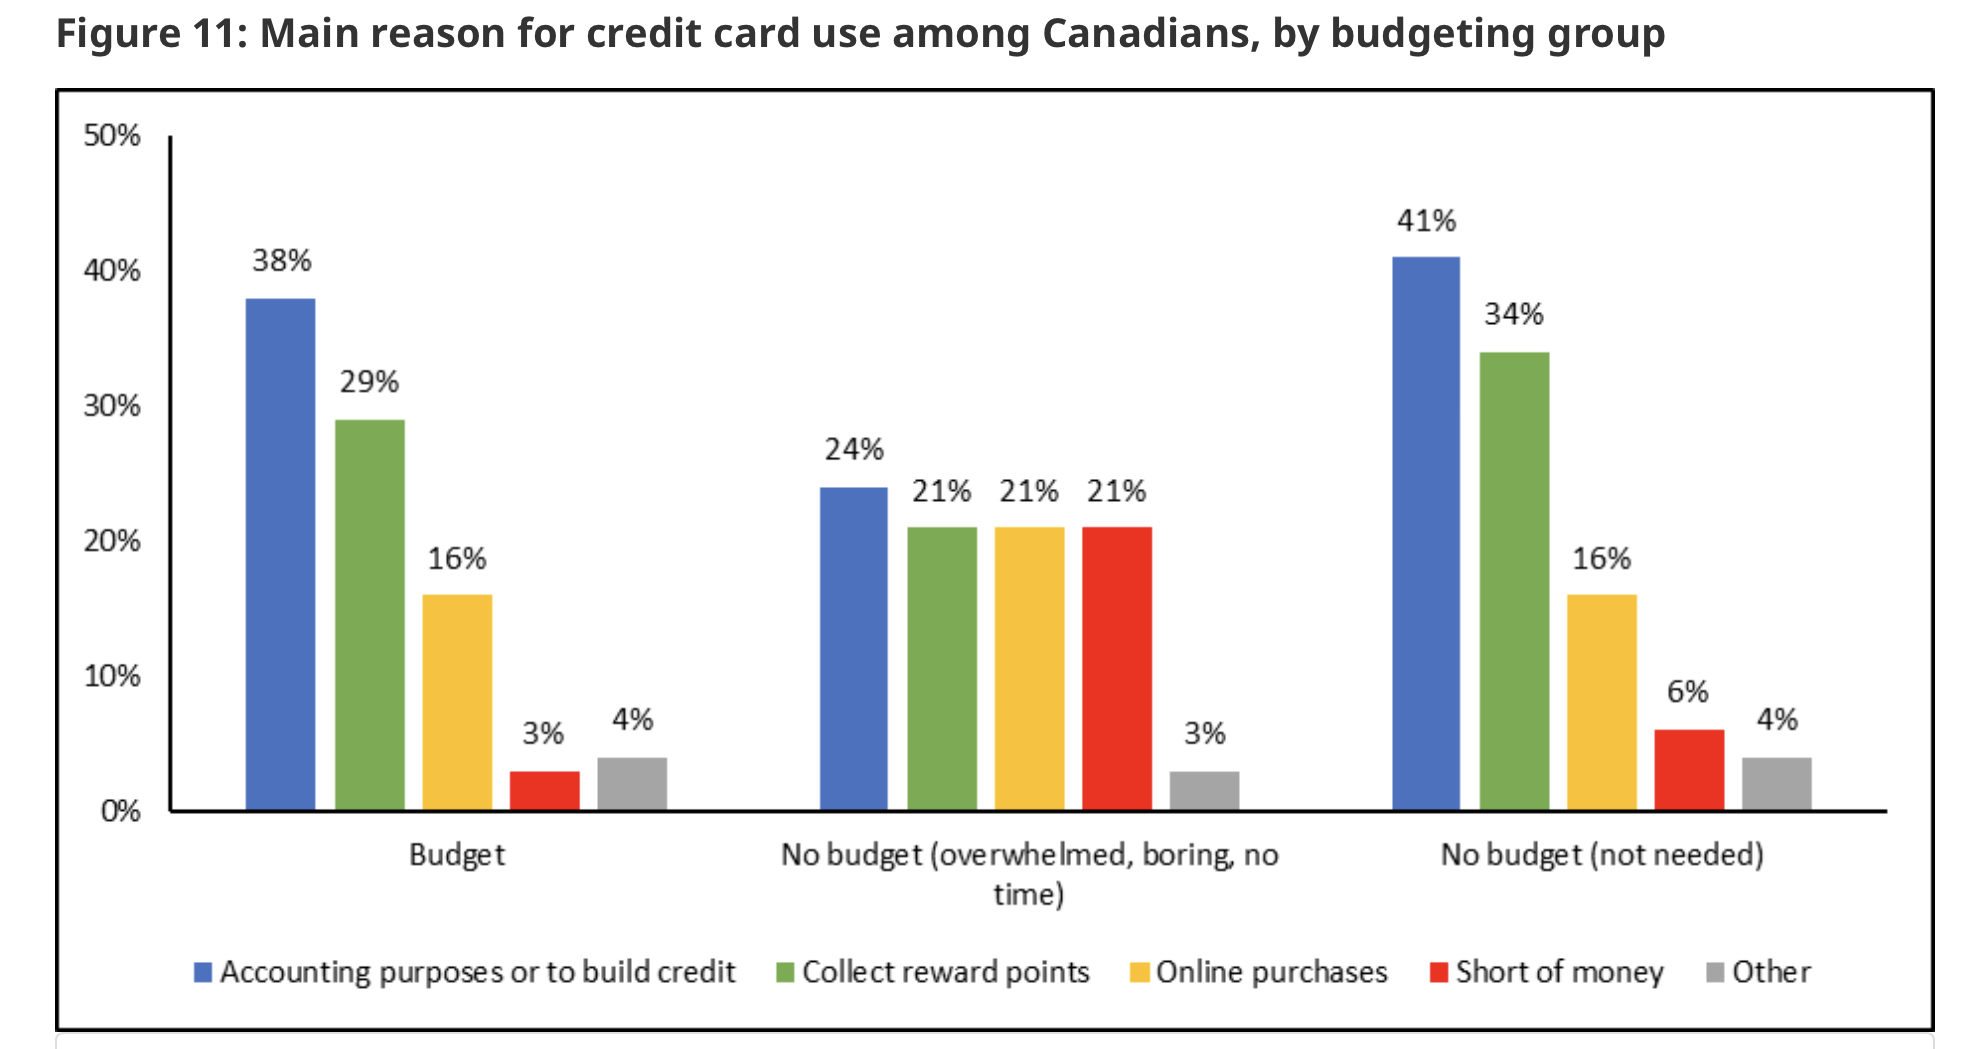
Budgeting may be related to credit card use. We see that among that the fraction who use credit cards because they are short of money runs at 21% among those who do not budget (they find it boring or have no time for it) while the percentage is 3% among those who do budgets.
Source: FCAC (2021)
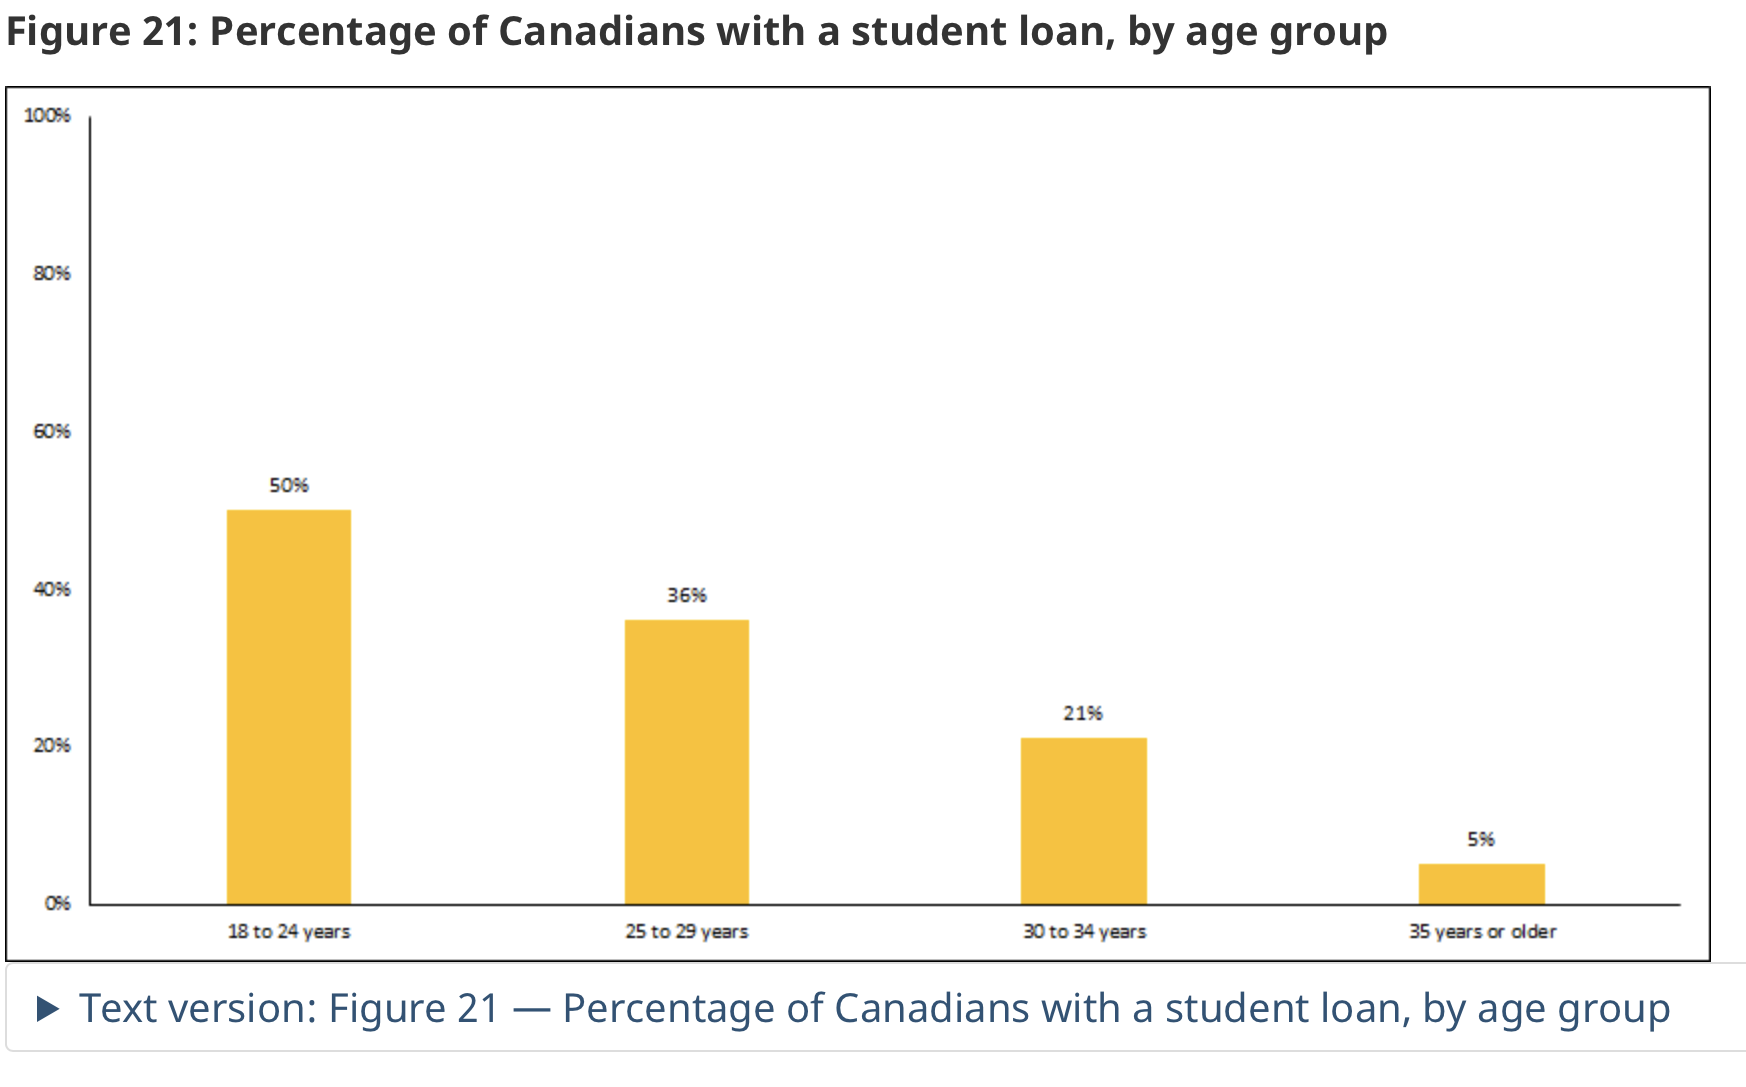
Student Loans
As the cost of education is increasing, in particular in provinces outside of Quebec, where tuition remains lower, student loans become much more prevalent. According to the FCAC study, half of individuals 16-24 have student loans. This percentage remains high at 36% among those 25 to 29 and 21% among those 30 to 34. By the time individuals reach 35 years old, only a small fraction has loans.
Source: FCAC (2021)
Payday Loans
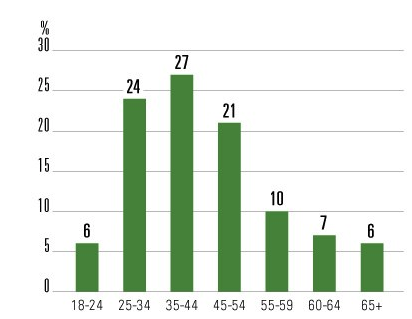
Between 2 and 4% of Canadians use Payday loans. These loans are typically for a few days, often synched with when people receive their paychecks. The interest rate charged on those loans can easily attain 50-100% on an annual basis. FCAC did a study in 2017 on payday loan users.
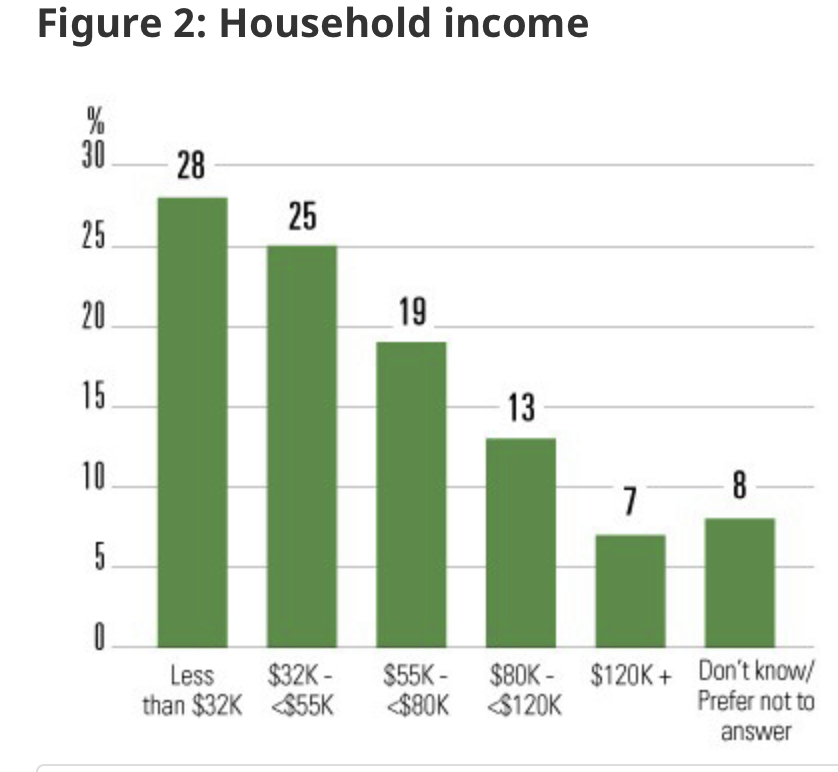
In terms of age, those 35-44 represent the largest share of users. Payday loan use, as one might expect is also associated with having low income although it is surprising that even those with relatively high incomes use those loans.
Source: OSF (2017)
Source: FCAC (2017)
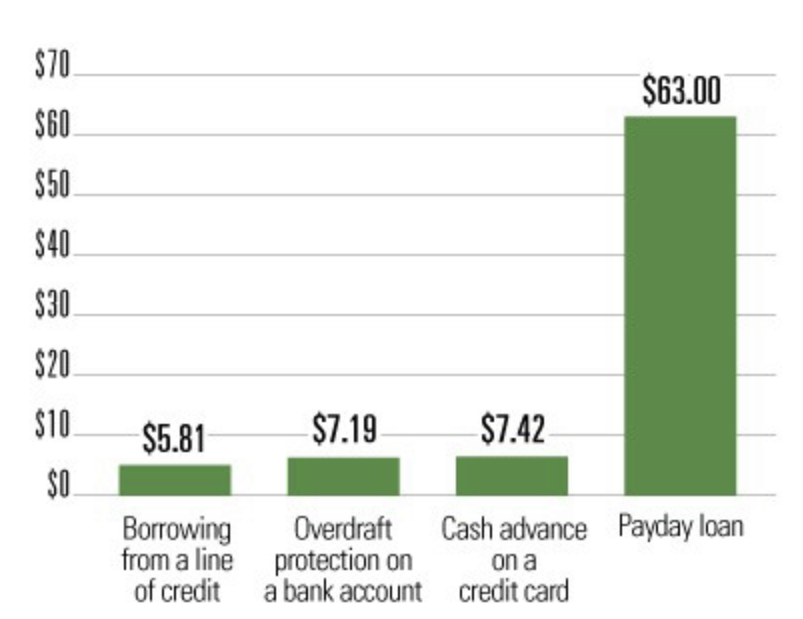
A 300$ payday loan taken for 14 days cost 63$ compared to 5.8$ for a line of credit, 7.2$ for an overdraft protection on a bank account or a cash advance on a credit card (7.4$). Hence, this is nearly 8-9 times more expensive.
Source: FCAC (2017)
When asked which one was the most expensive form of borrowing, only 43% of payday loan users correctly identified payday loans as the most expensive form of borrowing out of these sources.
Source: FCAC (2017)
Insolvency
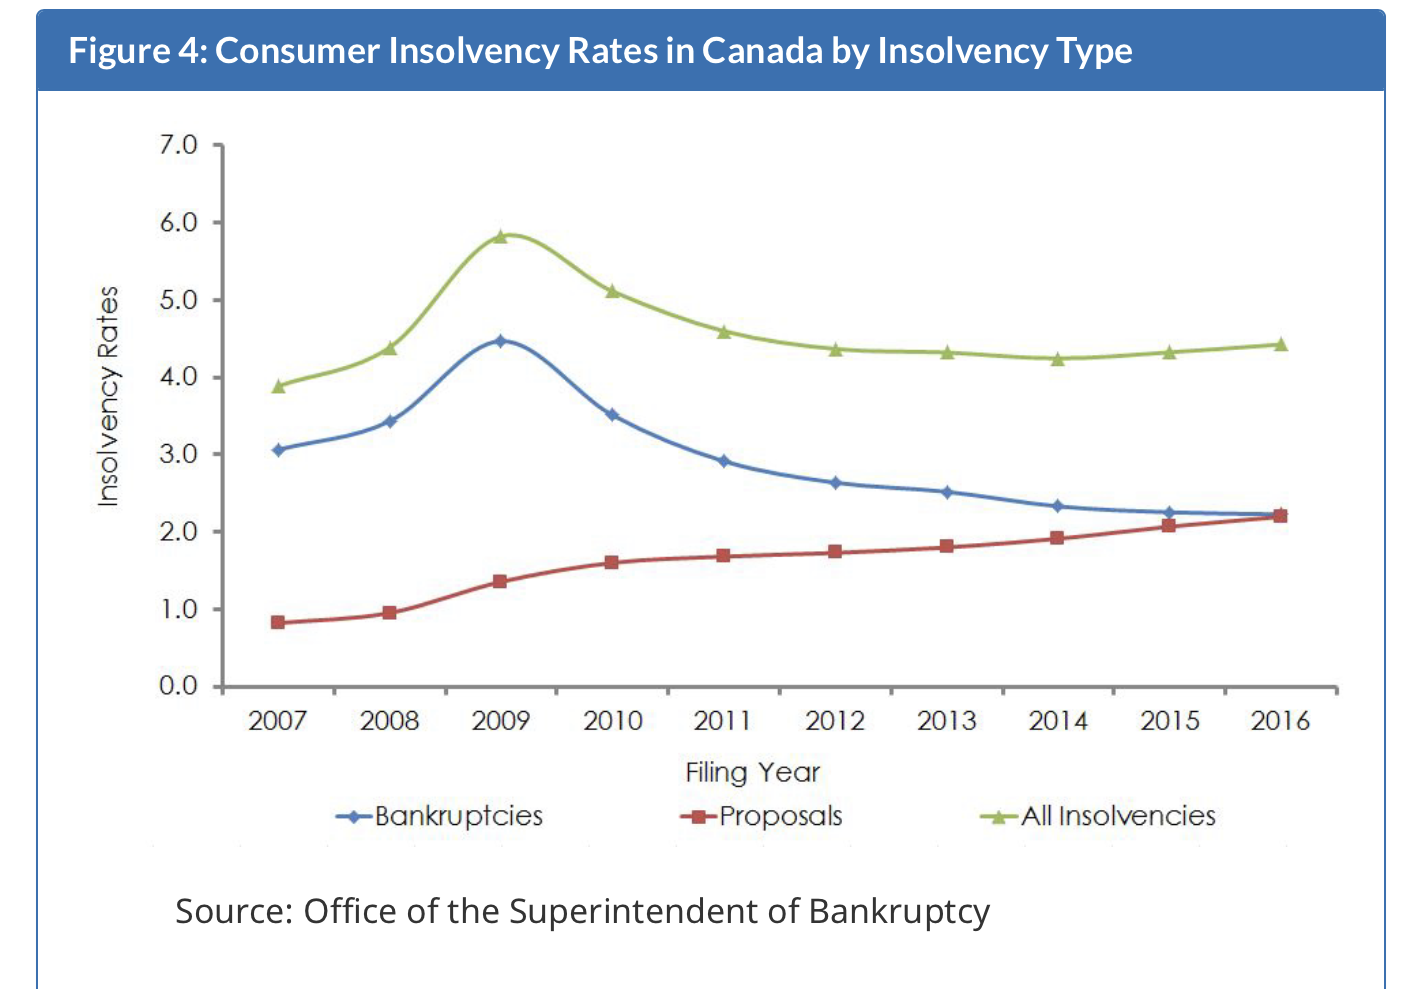
When debt becomes out of control, one needs to borrow just to make payments on existing debt. The fraction of Canadians who are insolvent is between 4 and 5%, with peaks in recessions. It is risen slightly in recent years. When individuals become insolvent, they enter a process which may ultimately lead to bankruptcy. While bankruptcies increase in recessions, they have declined recently while the approach has been to work with creditors to find a plan that avoids bankruptcy through a proposal. These have been on the rise in recent years.
Summary
Debt is on the rise. Whether this is a good thing or a bad thing remains to be seen. Right now, we lack a theoretical framework to think about debt in a way that would allow us to consider whether consumers are rational about debt and mostly benefit from increased availability as well as higher house prices.
Theory
What does the life-cycle model say?
The workhorse life-cycle model can help understand how debt can be useful for an individual. Consider the two period setup we used with savings. The individual has incomes \(y_1\) and \(y_2\). To simplify he has no initial wealth. Hence if period wealth is given by
If \(w^*>0\), he earns interest such that wealth available at the beginning of period 2 is given by \(w = (1+r_s)w^*\). If \(w^*<0\), he needs to pay interest on his debt, at a rate \(b\). Hence, the amount of debt that needs to be repaid is \(w = (1+r_b)w^*\). Typically we observe \(r_b>r_s\). Consumption in period 2 is \(c_2 = w + y_2\).
The individual has a utility function \(DU(c_1,c_2) = u(c_1) + \delta u(c_2)\) where \(\delta\) is the subjective discount factor. If \(r_b=r_s=r\), we have the first-order condition,
A situation with borrowing is one where \(u'(c_1)\) is much larger than the right-hand side. This will occur if income in the first period is quite low relative to income in the second period. This could arise because i) the individual had an income shock (for example lost his or her job), or ii) the individual is experiencing high income growth. This covers two cases where going into debt is optimal, i) to smooth income shocks, ii) to take advantage of income growth to smooth consumption. Hence, it may be perfectly optimal for the young who are likely to experience important income growth, for example university students, to contract debt, even at higher interest rates. With the same idea in mind, it may be optimal to use payday lending when income drops to zero in a particular week and one expects a large paycheck on one day of the week.
In this simple model, borrowing is limited how much the consumer can repay. Take the intertemporal budget constraint for someone borrowing,
where \(b = c_1 - y_1\). If at the extreme, the consumer does not consume in period 2, \(c_2=0\), then the value of the loan cannot be larger than second period consumption. Given that some spending is necessary, just to cover living expenses, banks will not lend, without collateral based on the full value of income (let alone that income in period 2 is uncertain). Instead, it will set a limit on lending, and potentially increase the interest rate on the loan relative to a secured loan. Hence, one could assume that there is a lending limit \(b_{max} = \phi y_2\) set as a fraction of income in the second period (or the first) with \(\phi<1\). For credit cards, limits will typically be set between 10 and 30% of income. Financial institutions have to guard against ability to repay risk, uncertainty and finally strategic default (when not repaying is in the interest of the consumer).
An important point is that consumers may want to borrow at very high interest rates. This will depend on their preferences and whether or not they have exhausted cheaper means of credit. If a consumer is quite impatient, has a low intertemporal elasticity is substitution (IES), and faces a large discrepancy between \(y_1\) and \(y_2\), he may want to borrow extensively. The following figure shows a situation where the consumer ends up exhausting cheaper types of credit to borrow at much higher rates. The slope of indifference curves matters and the slope is decreasing in \(\delta\) and increasing for low IES.
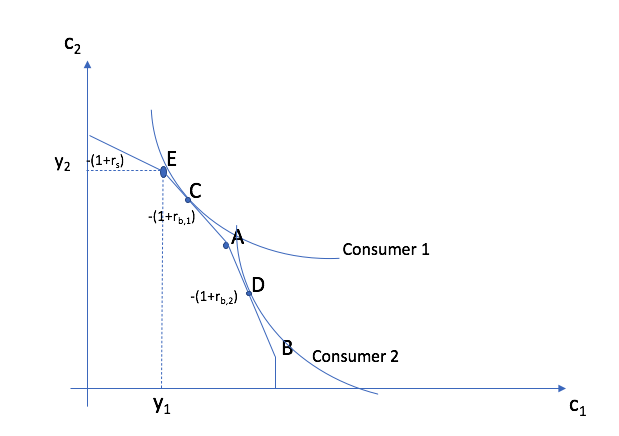
The consumer has a starting point at E, representing the consumption outcome where he would consume his income. He starts with low income in the first period and higher income in the second. To the left is his budget constraint if he saves (consumes less than income in the first period and more in the second. To the right of E, he borrows. He has access to two credit products, the first one with interest rate \(r_{b,1}\). At point A, he reaches the limit on how much he can borrow from this source of credit. He then uses a second source, with cost \(r_{b,2}\) until he reaches point B. At that point, he does not have access to more credit, so he can’t borrow more (the vertical segment). Consumers will use these products differently depending on their preference. Consumer 1 has a higher IES and perhaps higher discount factor, which means he only uses part of the credit available on the first source of credit. He consumes at point C. Consumer 2 is either more impatient or has lower IES. He borrows more and uses the first and second source of credit. He consumes at point D.
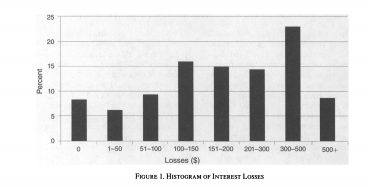
Hence, it is the marginal cost of credit which matters for the marginal decision to use a particular source of borrowing. One cannot judge a consumer using a particular source of credit, even if costly, without evaluating other options he or she has, and knowing preferences. Source: Zinman (2015) estimates what is the highest marginal borrowing cost for consumers in the U.S. and finds the following distribution.
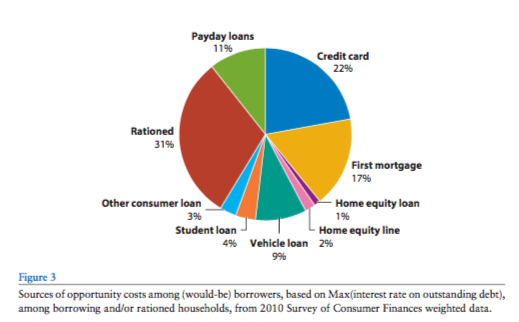
Source: Zinman (2015)
The measure of opportunity cost is the maximum interest rate paid on any debt. Now, 31% do not have debt, which is interpreted as rationed. But 11% have payday loans as the source of credit with the highest cost, followed by credit card (22%) and mortgages (17%). Other sources of credit are less prevalent. This needs to be interpreted with caution, but suggests that consumers have access to very different types of debt, with very different costs of borrowing.
Observing consumers who do not minimize cost of borrowing using existing sources of debt is one test that can be done to investigate whether debt is being used efficiently.
Minimizing the cost of borrowing
A number of studies investigate whether consumers minimize their borrowing costs using existing credit available to them. Here are three examples.
Agarwal, Chomsisengphet, Liu and Souleles (2015) study the introduction in a financial institution of two credit card offerings, one with a higher one-time fee but lower interest rate and another one without a fee but a higher interest rate. The optimal choice depends on how much one expects to borrow. If one expects to use the card a lot, the optimal choice is to pay the fee and has a lower interest rate and vice-versa if planned use is lower. Using data from the financial institution, they use past account balances as a proxy for future account balances. They then compute the optimal choice and compare it to the observed choice of account holders. They also compute the average savings from making the choice they make compared to using the other account. The Table below presents the key results from the paper.
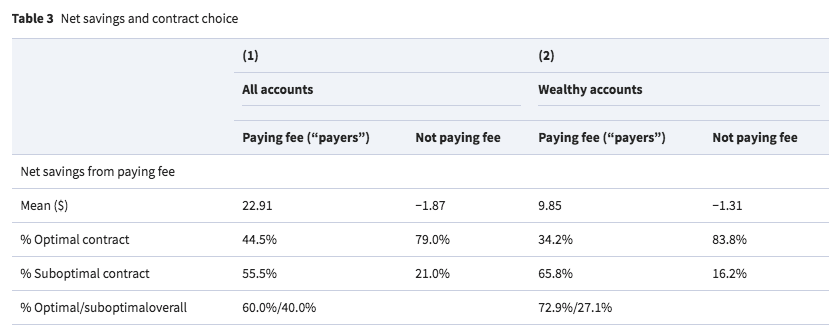
Source: Agarwal, Chomsisengphet, Liu and Souleles (2015)
Only 44.5% of those choosing to pay the fee are making the correct choice. Yet, the overall average savings from making this choice is 22.9$ which already suggest that those making a mistake are not making a large mistake and some are making substantial savings. For those not paying the fee, 79% are making the correct choice. The average savings is negative, which probably means that losers are losing quite a bit. If one uses wealthy accounts as a proxy for perhaps numeracy or financial literacy, results are not explained away. The authors conclude that despite a significant fraction making a mistake, these mistakes are not very costly in this context. As the stakes become larger (account balances larger), consumers appear to make the correct choice much more frequently. One way of explaining these results is that consumers make optimization errors when such errors are not costly. As the stakes become larger, consumers pay much more attention to picking the right credit product.
Agarwal, Skiba and Tobacman (2009) look at the choice between borrowing from a credit card and a payday loan. They check whether those who borrow from payday loans have also unused credit card borrowing space. This would suggest a misuse of credit vehicles since the interest rate on a credit card is much lower than on a payday loan. They used matched data from a Payday lender with credit card information. They find that most borrowers have credit card space when borrowing from payday lenders. They could have saved on average close to 200$ had they used their credit card instead of the payday loan. However, they are experiencing declining credit card space in times leading to the payday loan.
Source: Agarwal, Skiba and Tobacman (2009)
These results are somewhat consistent with the evidence presented above from FCAC that many payday borrowers do not understand the high cost of credit of payday loans. It also cautions against the interpretation that payday borrowing might be optimal because users have exhausted other forms of borrowing. As we will see below, one explanation for misunderstanding about the cost of credit is the inability of many to understand compound interest.
Laibson, Agarwal, Gabaix and Driscoll (2009) investigate other types of mistakes in selecting credit products. They are particularly interested by how cognitive skills help make financial decisions and use two tests based on credit product selection.
As we have already shown in the lectures on annuities, cognitive skills for financial decision-making is likely to be humped-shaped. First, some skills decline with age,
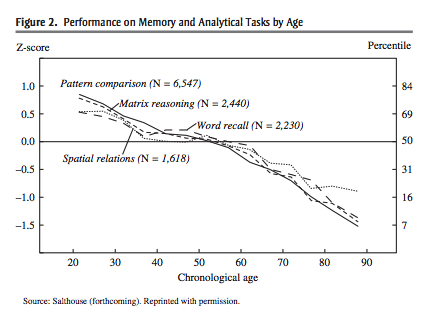
Source: Laibson, Agarwal, Gabaix and Driscoll (2009)
The humped shape pattern is likely to occur because crystallized intelligence, experience, is likely to increase and then plateau at some point. Hence, the combination of the two which is useful for performance on financial tasks could be humped shaped.
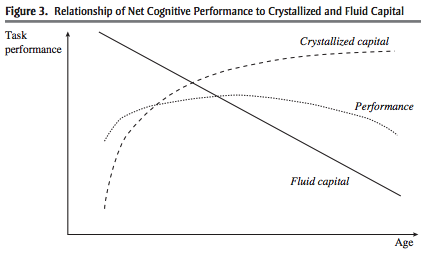
Source: Laibson, Agarwal, Gabaix and Driscoll (2009)
Eureka Moments
Credit card balance transfers are quite popular to attract consumers. They will offer a teaser interest rate on the balance transferred for some time. But new purchases on the card will face a much higher interest rate, often higher than the rate on the card the balance is transferred from until the balance has been paid off. Hence, the optimal strategy is to use the old card for new purchases while one pays off the balance at the teaser rate on the new card. The authors measure the amount of time it takes consumers to realize that this is what they should do (Eureka moment). They find that close to 75% of consumers eventually realize this. But the proportion is hump-shaped, with younger and much older consumers being less likely to realize that they should be using the old card for new purchases. The hump-shaped pattern is even more pronounced if we look at the proportion who realize within one month of having the card. Only 25% of those older than 65 have a Eureka moment.
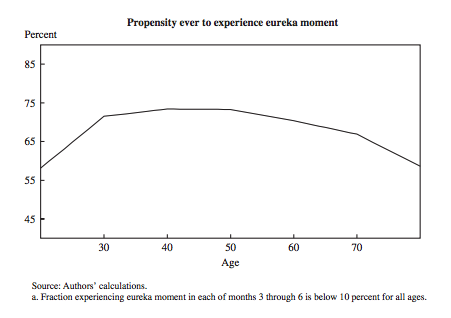
Source: Laibson, Agarwal, Gabaix and Driscoll (2009)
Lines of Credit
In the U.S., applying for a home equity line of credit requires consumers to provide an evaluation of their home. This is used to evaluate the loan-to-value ratio of the consumer, the ratio of the outstanding mortgage to the value of the house. The interest rate charged depends on this LTV. A higher LTV leads to a higher interest rate. If the consumer underestimates the value of the house, the bank is not obligated to use the true LTV (based on its own expert evaluation), but can use the LTV implied by the underestimated house value reported by the consumer. Hence, those who underestimate the most will face higher rates. They again find the humped shaped pattern (those in the middle face the lowest rates).
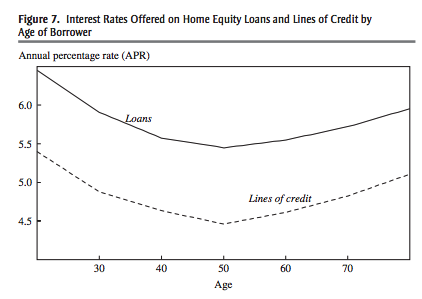
Source: Laibson, Agarwal, Gabaix and Driscoll (2009)
While other explanations are possible for some of these facts, it remains that they are consistent with higher costs of borrowing at the beginning and end of the life-cycle.
The Credit card puzzle
It has been noted that many consumers have positive liquid assets (large balances on bank accounts) and positive credit card balances. Given the cost of holding credit card balances, this appears to be a puzzle as consumers could save borrowing cost simply by paying off their balances.
One paper that has set off this literature on credit card and its puzzles is Gross and Souleles (2002). They document a number of interesting facts among which two are puzzling. First, individuals who have space in terms of credit limit increase their borrowing when their limit increases. This is counter to the basic permanent income hypothesis but possible when consumers and precautionary motives (they keep some space in case something large happens). The second one is potentially more puzzling: consumers hold credit card debt while having balances in low-yielding savings account. Hence, consumers could reduce their borrowing cost by simply paying off credit card debt. As this table shows, borrowers have on average 5 536$ in liquid assets.
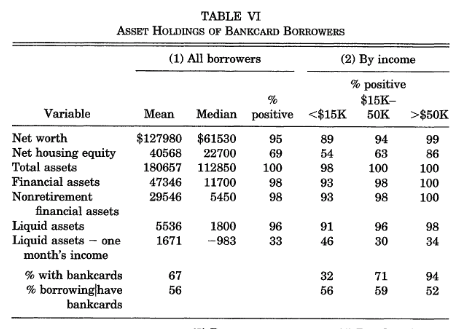
Source: Gross and Souleles (2002)
While someone carrying a credit card balance for several months while having positive liquid savings may be more puzzling, Zinman (2015) argues that a considerable fraction of this puzzle comes from consumers using their card as a transaction mechanism and paying each month their balance. This is becoming even more important as online commerce mostly takes place using credit cards. As we saw above, many hold cards mostly to get reward points or to make transactions. Few use it because they are short of liquidity.
Succumbing to Temptation
Present-biased models could explain why consumers hold short-term debt while having longer-term investments with lower yields. The short-term discount rate allows for short-term borrowing while the long-term discount rate allows for lower yield investments. One example is Angeletos et al. (2001). Turns out there is field experiment evidence that present-biased consumers are more likely to borrow from credit cards. In one paper, Meier and Sprenger (2009) conduct a survey to elicit present-bias in a 606 individuals at two tax assistance offices in Boston. They then merge their survey responses with credit card bureau behavior. They use MPLs to elicit the short term and long-term discount rates. Results of the regressions are shown below. Present-biased consumers were more likely to have credit card borrowing.
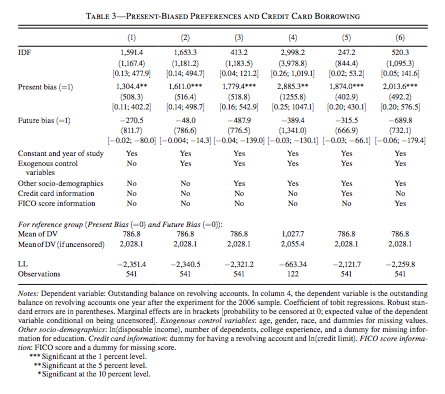
Source: Meier and Sprenger (2009)
An alternative theory to explain more extensive use of credit cards is linked to another type of preference known as temptation preferences. First proposed by Gul and Pessendorfer, these preferences allow consumers to succumb to temptation, in which case they consume a lot, and potentially borrow. Consumers fight these temptations and as a result make choices which are different from a consumer that does not have to face those temptations. Because they need to fight these temptations, consumers incur a welfare cost, relative to a situation where there is no temptation. In the case of credit expansions, this can lead to a result where welfare (well-being) decreases which is impossible in a rational world (expanding the choice set should not hurt consumers).
Nakajima (2011) is a direct modeling application of these preferences to borrowing. When credit card limits are expanded, consumers are made worse off because the cost of resisting to temptation is larger which eliminates the welfare gains from credit possibilities. The Figure below shows that welfare gains of higher access to credit disappears when temptation is introduced in the model.
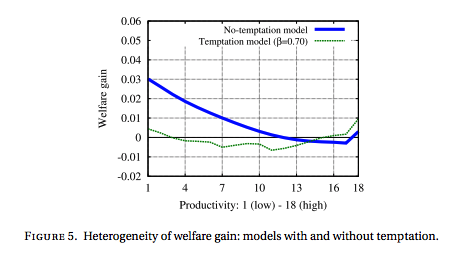
Source: Nakajima (2011)
Applications of this type of model as well as present-bias models have seen an explosion in recent years.
Exponential growth bias and credit
Levy and Tasoff propose an alternative explanation for over borrowing (and undersaving), i.e. consumers do not understand exponential growth (compounding) and linearly compound instead (say 100 dollars at 2% for 5 years is worth 110). They term this bias exponential growth bias (EGB). For example, the Lusardi and Mitchell questions on financial literacy tests whether consumers understand in part compounding. But because the amount use in the multiple choice is not aimed directly at testing compouding vs. linear discounting (102 is used while 110 should be the break-even point for an investment at 2% for 10 years), it is not direct evidence of EGB.
One way of measuring on a continuum the degree of EGP is to postulate a future value function of the form,
An individual with \(\alpha=1\) does not suffer from bias while a consumer with \(\alpha=0\) uses linear discounting. As a result he underestimates the future value of an asset but also of debt. It is unclear overall how EGB will impact savings and debt (or consumption). It will generally depend to potentially opposing income and substitution effects. But it has the potential of delivering extensive borrowing.
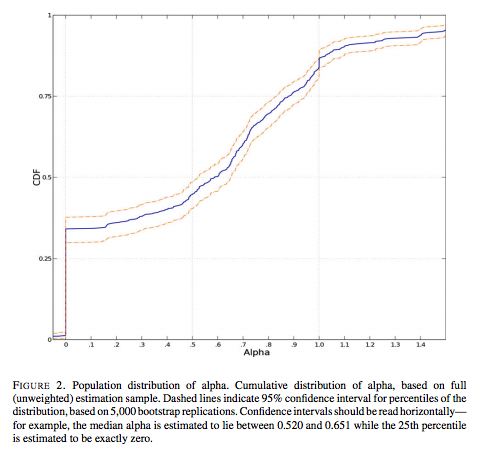
Source: Levy and Tasoff
Minimium Payments and Anchoring
A common feature of credit cards is that they often suggest a minimum payment. It is unclear why the payment is set so low. When the payment is low, the credit card balance decreases only slowly and the financial institution potentially gains in terms of interests charged. Hence, there is potentially a motive for financial institutions to mention a minimum payment if consumers anchor their payment to this suggested payment. This sort of anchoring effect may increase borrowing costs for consumers.
Keys and Wang (2019) look at how consumers change their payment behavior when the minimum payment changes. In the figure below, they find that when the minimum payment increases, the fraction paying the new minimum or less decreases. Consistent with anchoring they find the opposite effect when the minimum payment decreases the fraction paying the new minimum payment or less increases substantially. The anchoring effects can be quite profitable for financial institutions as they increase borrowing costs for consumers, in particular if consumers misperceive borrowing costs, perhaps because of EGB.
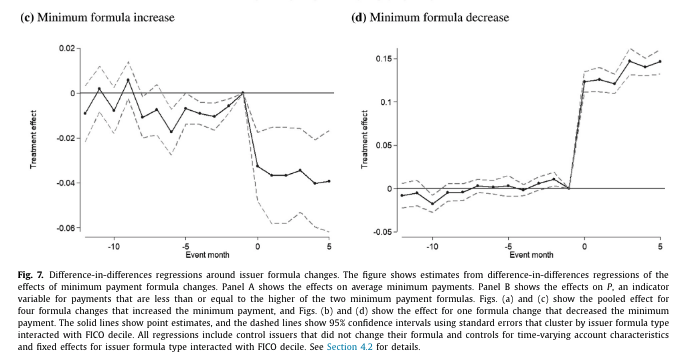
Source: Keys and Wang (2019)
Summary
From a theoretical perspective, debt is not necessarily bad. The level of optimal debt depends on preferences and on the availability of various forms of credit. Yet, we do observe what appears to be over-borrowing for certain types of debt products, in particular payday loans and credit cards. Various behavioral explanations, with sometimes limited success, have been proposed to explain these puzzles. As Zinman (2015) writes, there is still lots to uncover regarding debt as it is an understudied aspect of the balance sheet of households.